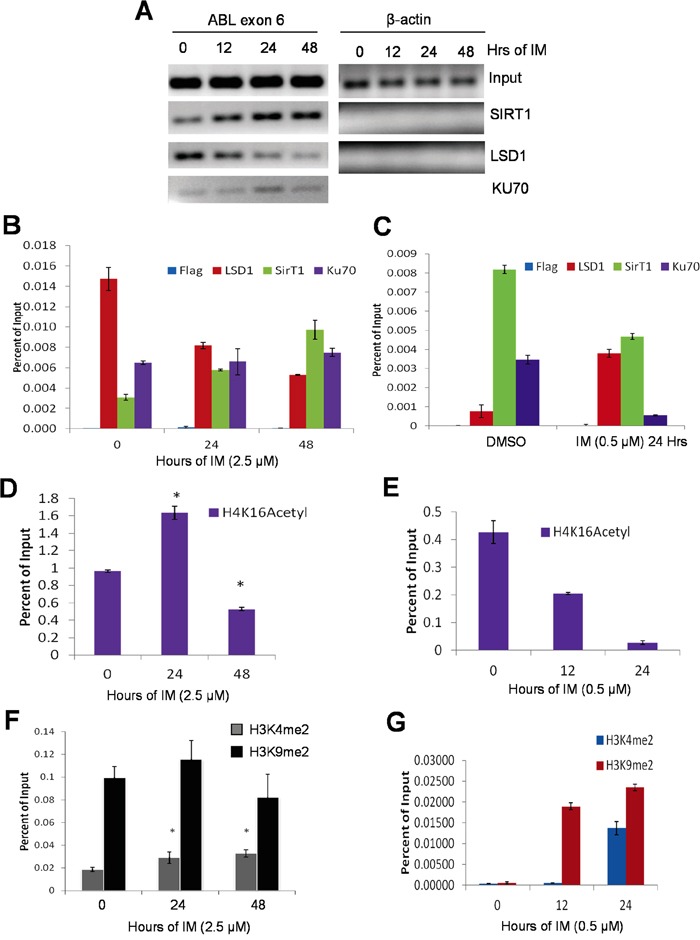
Figure 4. Opposite recruitment of LSD1 and SIRT1 to the ABL locus.

A, B. A, agarose gel images of standard ChIP-PCR for ABL exon 6 and β-actin in KCL-22 cells treated with 2.5μM IM for 0, 12, 24 or 48 hours. KU70 was not examined on β-actin. Primers that surround the β-actin transcription start site were used for PCR. B, quantitative ChIP-PCR of the ABL exon 6 of KCL-22 cells treated with 2.5μM IM for 0, 24 or 48 hours. Y-axis values are percents of Input for each respective time point. Bars are means of triplicates and error bars are standard error of the means (n=3). C. Bar graphs representing ChIP-qPCR of the ABL exon 6 of mock or 0.5μM IM treatment for 24 hours in KU812 cells; bars represent means and error bars are SEM. D-G. ChIP-PCR histone mark analysis of ABL exon 6 in KCL-22 cells treated with 2.5μM IM (D and F) IM and in KU812 cells treated with 0.5μM IM for indicated times. ChIP-PCR results were triplicates from a representative experiment, and similar patterns were observed in repeated experiments.
