
Figure 8. Opposing actions of LSD1 and SIRT1 in acquisition of BCR-ABL mutations.
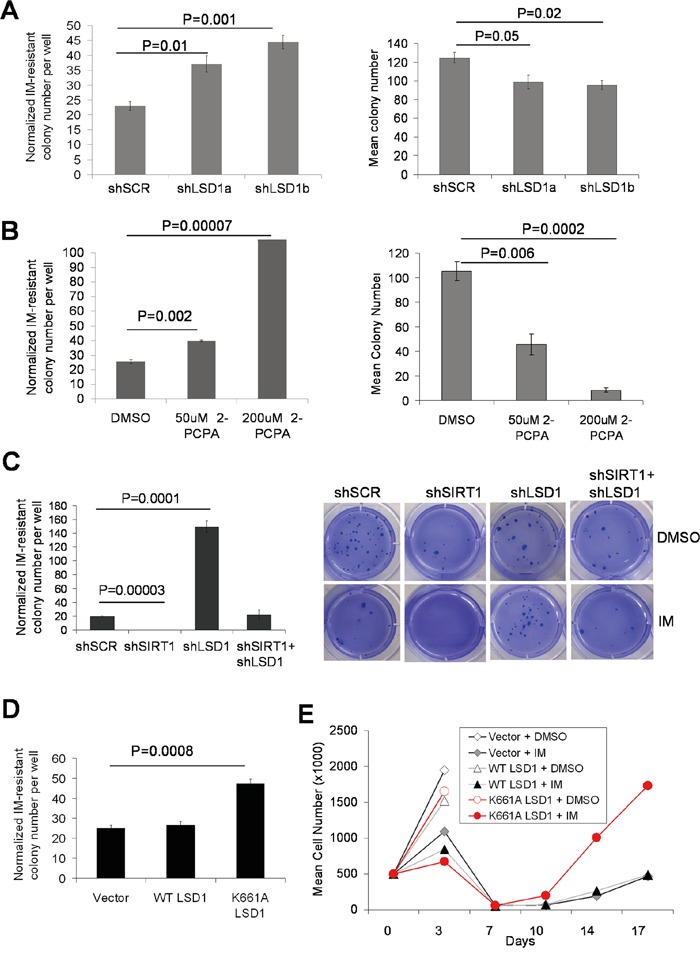
A-D. Bar graphs representing relative mutation frequencies of imatinib-resistant KCL-22 colonies with 2.5μM IM treatment after normalization to DMSO mock treatment (plating efficiency). Values are means and error bars are SEM. A, left panel: change of mutation frequencies after LSD1 knockdown using two independent LSD1 shRNAs compared to Scrambled shRNA; right panel: plating efficiency. B, left panel: effect of LSD1 inhibitor 2-PCPA on KCL-22 cell mutation upon IM treatment; right panel: plating efficiency. Treatment of 2-PCPA was started 72 hours before IM treatment was initiated to simulate LSD1 knockdown. C, left panel: relative mutation frequencies of KCL-22 cells after knockdown of LSD1, SIRT1, double knockdown of LSD1/SIRT1 or Scrambled shRNA; right panel: representative images of IM-resistant cell colonies. D, relative mutation frequencies of KCL-22 cells stably expressing WT LSD1, catalytically-inactive K661A LSD1 or vector alone. E. Effect of mutant LSD1 expression on KCL-22 cell relapse on IM in liquid culture. Growth curves showing cell counts of KCL-22 cells stably expressing WT LSD1, K661A LSD1 or vector alone, in the presence and absence of 2.5μM IM.