
Figure 4. Anti-CD40 and sunitinib therapy synergistically induce endothelial activation and cytotoxic CD8+ T-cell infiltration into the tumor.
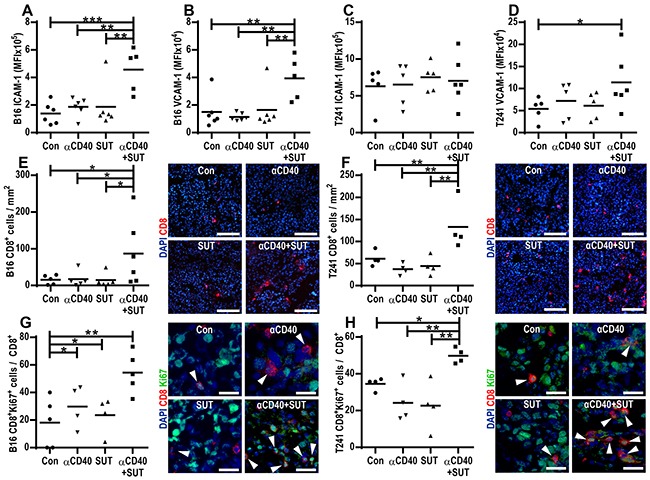
A-D. Endothelial activation in B16.F10 and T241 tumors treated with anti-CD40 mAb and/or sunitinib or control. FACS analysis of ICAM-1 and VCAM-1 surface expression in endothelial cells (CD45−CD31+) from B16.F10 (A-B) and T241 tumors C-D. Values represent MFI of ICAM-1 and VCAM-1 in tumor endothelial cells isolated from different mice (mean, *p < 0.05, **p < 0.01, ***p < 0.001, one-way ANOVA). E-F. Quantification of CD8+ (red) T-cell immunofluorescence staining in B16.F10 (E) and T241 (F) tumor sections counterstained with Hoechst 33342 (blue). The graphs show the number of CD8+ cells/mm2 in tumor sections from different mice (mean, *p < 0.05, **p < 0.01, one-way ANOVA). Representative images from B16.F10 (E) and T241 (F) tumor sections are shown (20x, scale bar: 100 μm) G-H. Ratio of proliferating Ki- 67+CD8+ to total CD8+ T-cells in B16.F10 (G) and T241 (H) tumors analyzed by immunofluorescence staining (data points show analysis of 5 optical fields/tumor, mean, *p < 0.05, **p < 0.01, one-way ANOVA) and representative images (40x, scale bar: 25 μm, Ki-67-green, CD8-red, Hoechst 33342-blue). Data points indicate analysis of tumors in different mice one day after the last treatment.