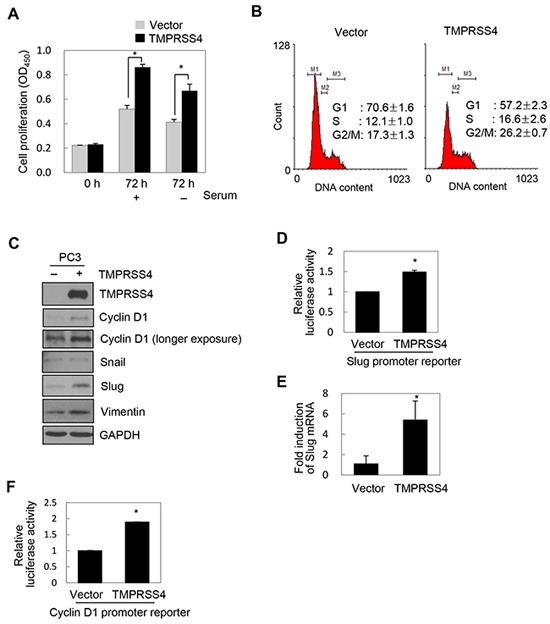
Figure 1. TMPRSS4 induced proliferation and upregulated Slug and cyclin D1.

A, B, C, E. PC3 cells were transfected with a TMPRSS4 expression vector for 48 h. (A) Transfected cells were seeded into 96-well plates at a density of 3000 cells/well and incubated for 24 h. Cells were further incubated for 48 h in the presence or absence of serum. Cell proliferation was determined by the colorimetric WST assay. (B) Cell cycle analysis of transfected cells using flow cytometry. Percentages of cells in each phase are shown. (C) Transfected cells were lysed and used for immunoblotting. An anti-myc antibody was used to detect myc-tagged TMPRSS4. GAPDH was used as an internal control. D. PC3 cells were co-transfected with a TMPRSS4 expression vector and a Slug promoter (−981/+174) reporter construct in the pGL4 vector. Firefly luciferase activity, representing Slug promoter activity, was measured after 48 h and normalized to Renilla luciferase activity to determine the transfection efficiency. (E) Transfected cells were lysed and used for real-time qPCR analysis of Slug mRNA levels. F. PC3 cells were co-transfected with a TMPRSS4 expression vector and a cyclin D1 promoter (−962/+134) reporter construct. Luciferase activity was measured as in (D). Values represent mean ± standard deviation (SD). *P < 0.05.
