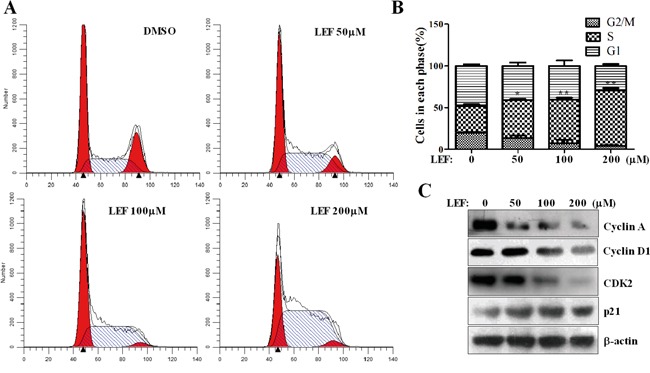
Figure 2. LEF induces cell-cycle arrest.

A. After LEF treatment for 48 h, Caki-2 cells were stained with PI and subjected to cell cycle analysis by flow cytometry. One representative experiment out of three is shown. B. The statistical analysis of cell percentage of cell-cycle distribution. Data represent mean ± SD of three independent experiments (*P<0.01, ** P<0.05, vs. the control). C. Changes in cell-cycle regulatory proteins after LEF treatment for 48 h. Representative images from at least three independent experiments are shown.
