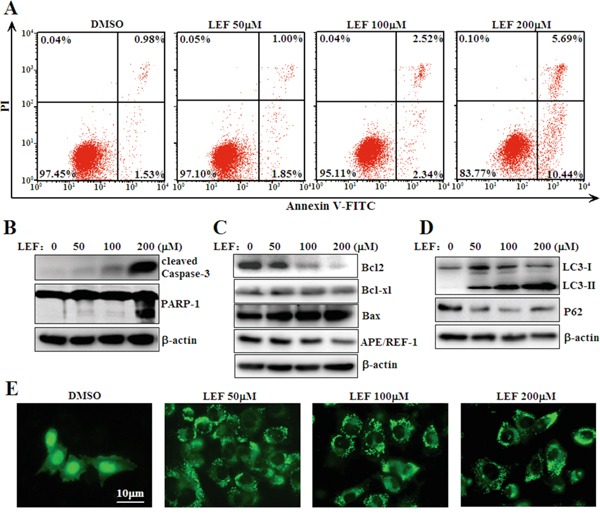
Figure 3. LEF triggers cell apoptosis and autophagy.

A. Flow cytometry analysis of apoptosis was determined using Annexin V-FITC/PI staining in Caki-2 cells treated with LEF for 48 h. Data are typical of three similar experiments. The percentage of Annexin V-FITC and/or PI positive cells was depicted with cytofluorometer quadrant graphs. B. LEF treatment induced cleavage of caspase-3 and PARP-1 as indicative of apoptosis. C. Expression alterations of anti-apoptotic and pro-apoptotic proteins after LEF treatment for 48 h. D. Changes in autophagy-associated proteins after LEF treatment for 48 h. Representative images in B, C, and D, are from at least three independent experiments. E. Visualization of GFP-LC3 fluorescence in Caki-2 cells after LEF treatment for 48 h.
