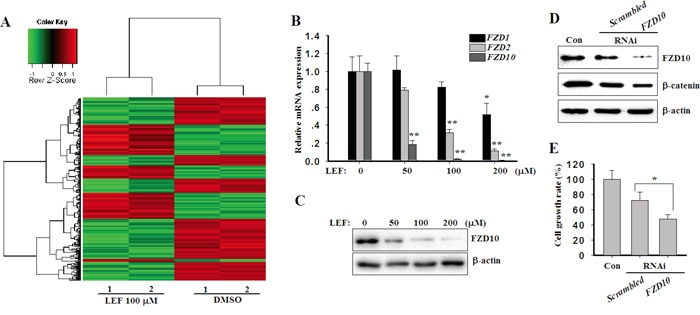
Figure 7. LEF decreases the expression of FZD10.

A. Heatmap of hierarchical clustering of gene expression from Caki-2 cells treated with 200 μM LEF or vehicle control. B. Real-time PCR for the expression of FZD1, FZD2, and FZD10 in mRNA levels after LEF treatment. Data represent mean ± SD from three independent experiments C. Changes of FZD10 proteins after LEF treatment for 48 h. D. Caki-2 cells were transfected with FZD10 or scrambled siRNAs respectively. After 48 h, western blot detected the protein levels of FZD10 and β-catenin. Representative images from at least three independent experiments are shown. E. Cell growth was estimated by MST assay after siRNA transfection for 72 h. (*P<0.01, ** P<0.05, vs. the control).
