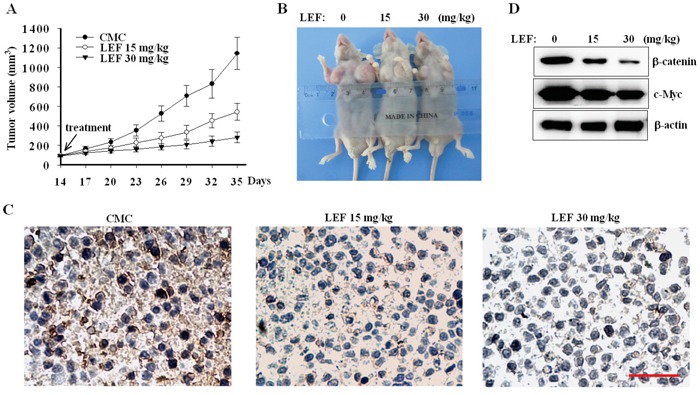
Figure 8. LEF suppresses xenograft tumors in mice model.

A. The rates of xenograft growth were monitored at indicated days in NOD/SCID mice receiving LEF or vehicle. Error bars represent standard deviations, n = 8. B. Tumor samples showing final tumor size after mice were sacrificed. C. Representative immunohistochemical staining of FZD10 in xenograft tissues. Scale bar 50 μm. D. Immunoblotting analysis of β-catenin and c-Myc from xenograft tumors treated with LEF or vehicle (n = 5). One representative experiment out of three is shown.
