
Figure 1. Kaplan-Meier curves of liver metastases on four candidate lncRNAs in patients with stage I/II CRC.
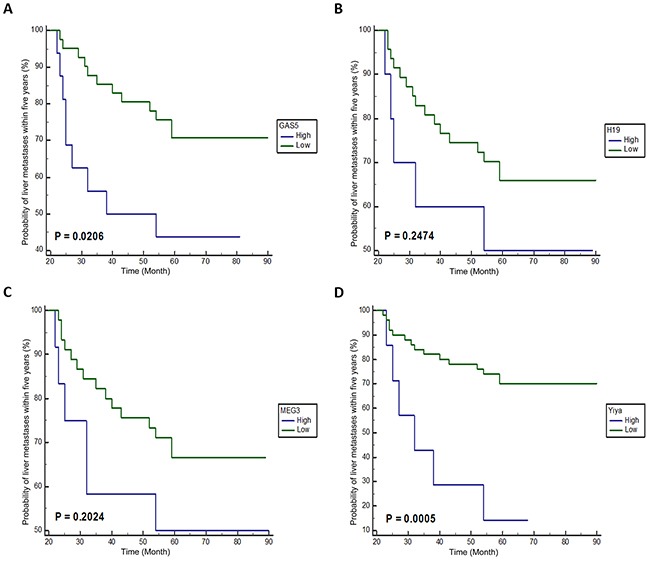
A-D. Kaplan-Meier curve of GAS5, H19, MEG3 and Yiya, respectively. High, high expression level ≥ mean 2ΔCq; Low, low expression level < mean 2ΔCq.