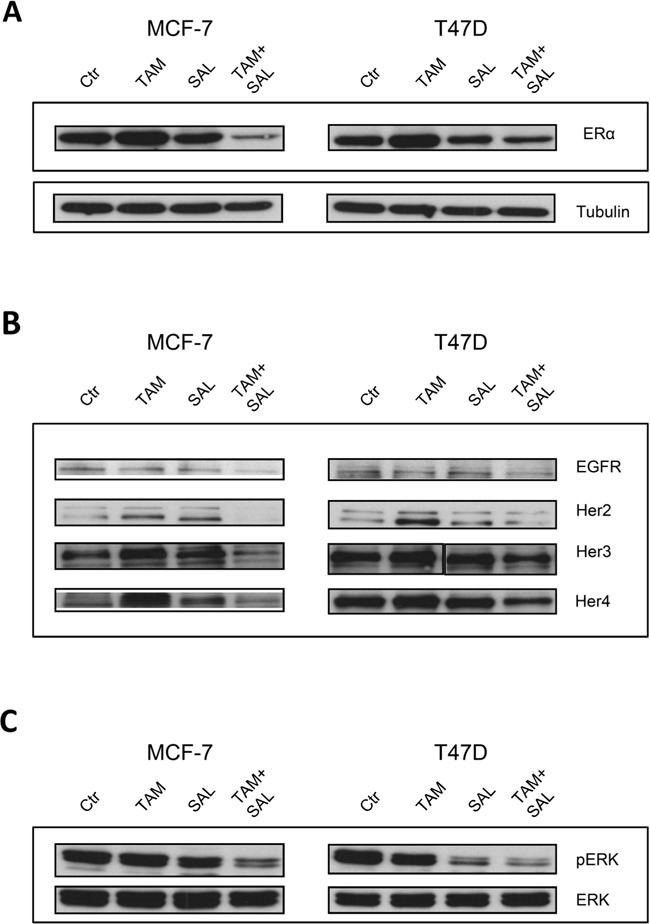
Figure 2. Characterization of cytotoxicity.

Western blot analysis of two luminal A breast cancer cell lines MCF-7 and T47D upon 72h treatment with 10μM tamoxifen, 0,5μM salinomycin or the combination. Tubulin was used as loading control and is representative for all blots. A. Expression of ERα upon treatment. To investigate the protein expression of ERα total cell lysates were utilized. B. Ligand independent signaling of ERα. Total cell lysates were analyzed for protein expression levels of Egfr-family members. C. Ligand independent signaling of Erk1/2. To investigate the protein expression of Erk1/2 total cell lysates were utilized.
