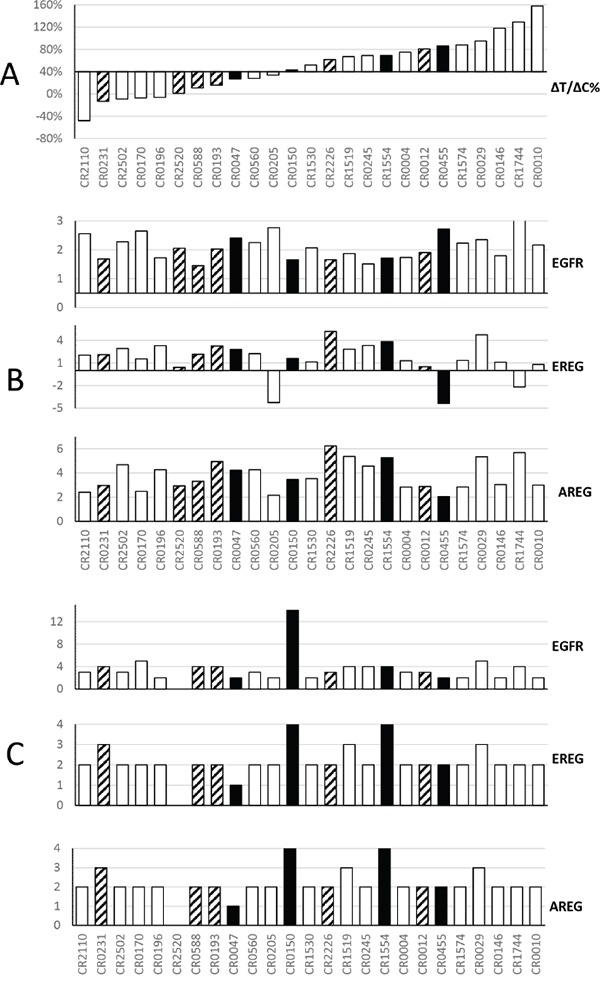
Figure 1. Summary of cetuximab activity and corresponding genomic profiles of EGFR, Epiregulin and Amphiregulin in a cohort of CRC-PDXs.

Panel A. Waterfall plot of the ΔT/ΔC% of PDX: cetuximab vs. control, ranked from responders on the left to non-responders on the right (Y-axis: ΔT/ΔC). The open bars are wild type KRAS, the solid bar are KRAS G12D/V/C mutants, and the shaded bars are KRAS G13D mutants. Panel B. For 25 models ranked as in panel A, y axis shows RNA expression intensity [13], from top to bottom, for EGFR, EREG and AREG. RNA values are in log10 scale. Panel C. For 25 models ranked as in panel A, Y axis shows gene copy number per PICNIC [13]. The cetuximab treatment in mice was extensively described previously [13]. Briefly, when tumor volume reaches 100–150 mm3, the mice were grouped and subjected to either PBS or cetuximab (IP, weekly for 2 weeks, 1mg per mouse).
