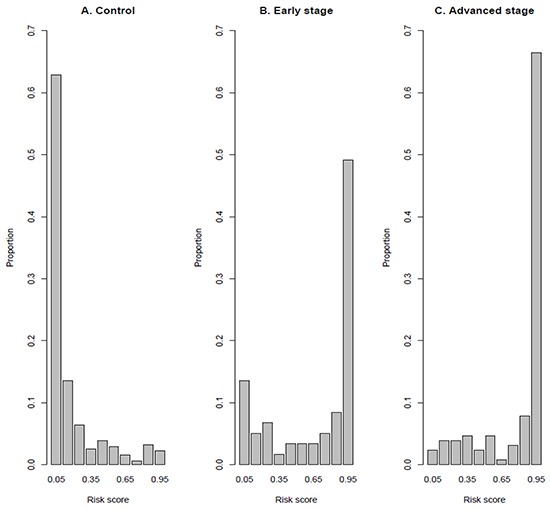
Figure 1. Histogram of risk score of samples (Proportion).

A. Controls; B. Cases with early stage disease and C. Cases with advanced stage disease. The risk score is calculated using LCM classification model (Table 3).

A. Controls; B. Cases with early stage disease and C. Cases with advanced stage disease. The risk score is calculated using LCM classification model (Table 3).