
Figure 1. Cambogin inhibits cell proliferation and modulates mitochondrial network in MCF-7 cells.
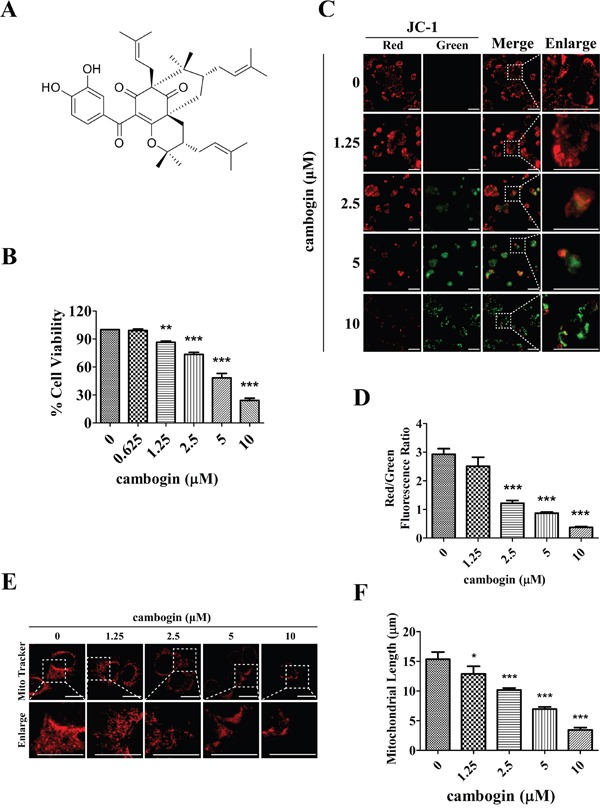
A. Chemical structure of cambogin. B. MCF-7 cells were treated with cambogin (0-10 μM) for 24 h. Cell viability was measured by MTT assay. C, D. MCF-7 cells were exposed to cambogin (0-10 μM) for 4 h. The percentage of cells with a reduction in ΔΨm was measured using the fluorescent dye JC-1 (10 μM). After incubation, stained cells were observed under an inverted fluorescent microscope (C) and were measured by microplate fluorescence reader (D). JC-1 dye changes color as the membrane potential increases. At higher membrane potentials, JC-1 forms aggregates, which changes the fluorescence emission color from green to red. Scale bar=100 μm. E. MCF-7 cells were treated with cambogin (0-10 μM) for 24 h. After treatment, the cells were washed, stained with MitoTracker Red for 1 h, washed again, and analyzed for mitochondrial network under confocal microscopy (×1000). Scale bar=20 μm. F. Statistical analyses of the average mitochondrial length for experiment E. Data are shown as means±SEM; *P<0.05, **P<0.01, ***P<0.001 compared with control. n=3.