


Figure 1. Inter-individual enzyme activities in 102 hepatocellular carcinoma (HCC) HLMs and 105 control HLMs.
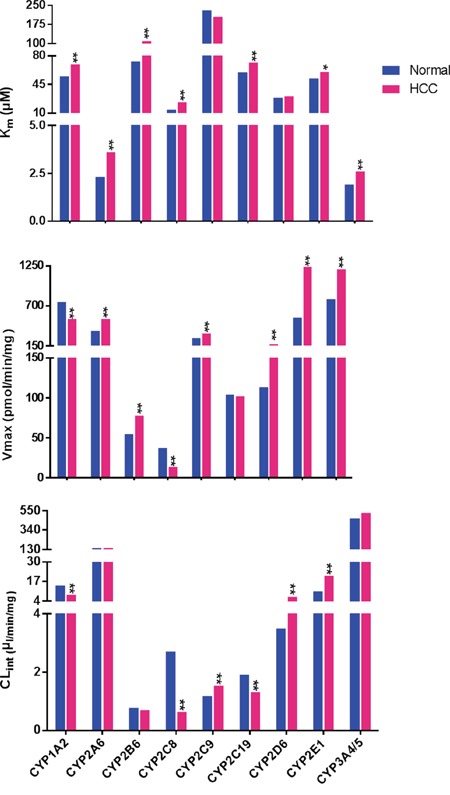
Enzyme activities are expressed as the median values. Blue bars represent enzyme activity in control HLMs. Red bars represent those from HCC group. “*”, “**” denote significant differences from controls (P < 0.05 and P < 0.01, respectively) by the Mann-Whitney U test.