


Figure 2. The km, Vmax and CLint values of 10 CYPs in the fibrosis group, cirrhosis group, and control subjects.
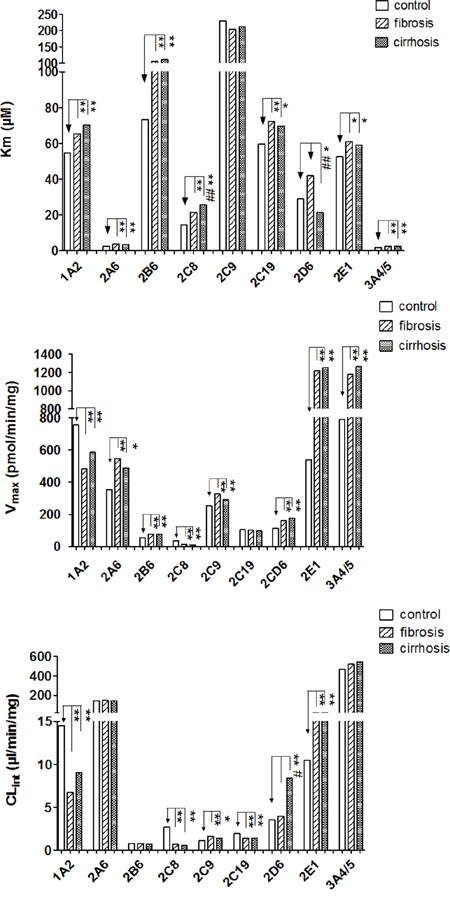
Data are shown as bar graphs representing medians. Blank bars represent enzyme activity in controls. Stripe bars represent enzyme activity from the fibrosis group. Dot bars represent enzyme activity in the cirrhosis group. “*” and “**” denote differences that are significantly different from controls (P < 0.05 and P < 0.01, respectively), “#”, “##” denote significant differences from the fibrosis group (P < 0.05 and P < 0.01, respectively) by the Mann-Whitney U test.