
Figure 3. Inter-individual and inter-genotype enzyme activities in 102 hepatocellular carcinoma (HCC) samples and 105 control samples.
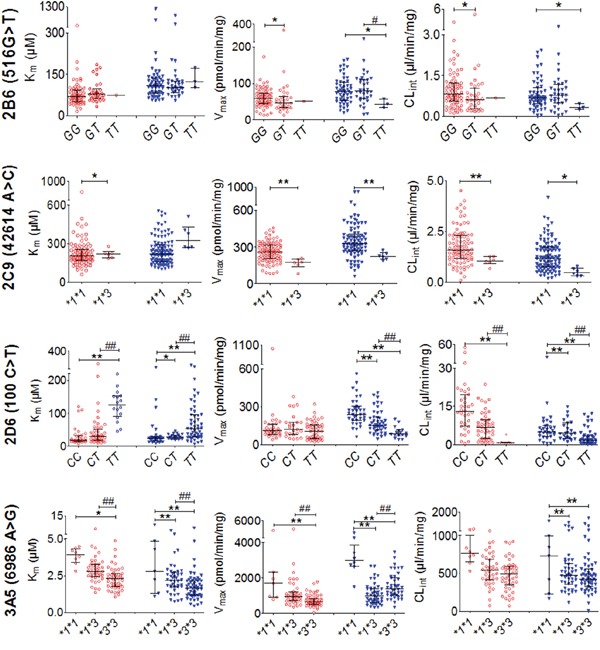
Red open circles (○) represent enzyme activity in control HLMs; Blue triangles (▼) represent those from the HCC group. Horizontal lines indicate median with inter-quartile range. “*”, “**” denote differences that are significantly different from wild-type (P < 0.05 and P < 0.01, respectively), “#”, “##” indicate significant differences from the mutant heterozygote (P < 0.05 and P < 0.01, respectively) by the Mann-Whitney U test.