


Figure 4. Effect of demographic factors on CYP activity.
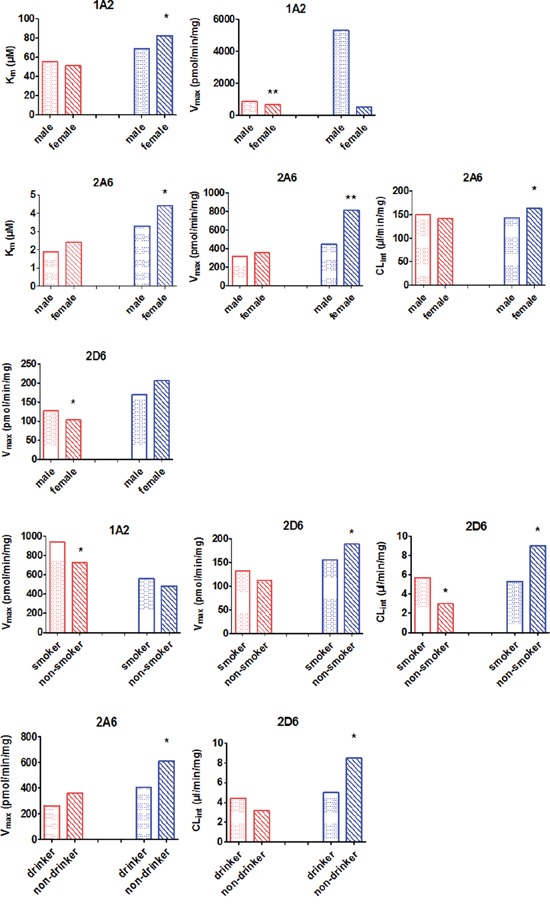
Data are shown as columns representing median individual metabolic parameters. Red bars represent the enzyme activity in controls. Blue bars represent the enzyme activity from the HCC group. “*” and “**” indicate significant differences from male/smoker/drinker by the Mann-Whitney U test.