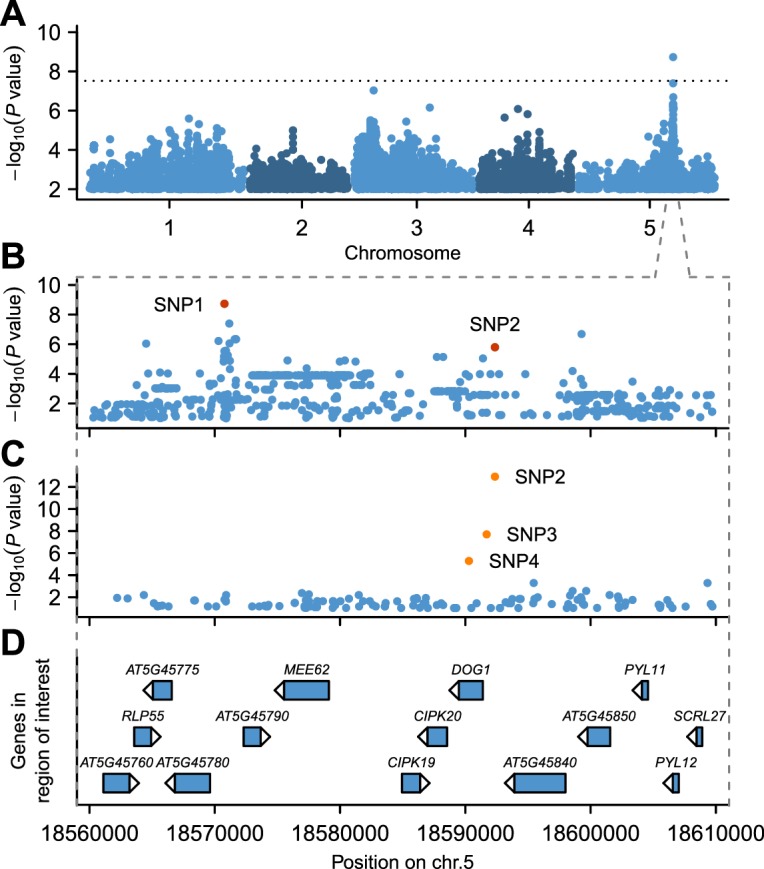
Figure 2. GWAS for primary seed dormancy on a set of 161 A. thaliana Swedish accessions.
(A) Manhattan plot of genome-wide association results for GR21. The dotted horizontal line indicates a significance level of 0.05 after Bonferroni correction for multiple testing. (B) Magnification of the peak region on chromosome 5. The most significant SNP (SNP1) was located at position 18,570,773. SNP2 (18,592,365) is in moderate LD with SNP1, despite a physical separation of almost 21 kb. Both SNPs are highlighted. (C) Output of a local multi-locus association scan using SNP2 as starting point. The resulting optimal model consisted of three highlighted SNPs at the DOG1 locus: SNP2, SNP3 (18,591,702) and SNP4 (18,590,289). (D) Annotated genes in the region under the peak. The GWAS results can be viewed interactively online (https://goo.gl/30EPt3).

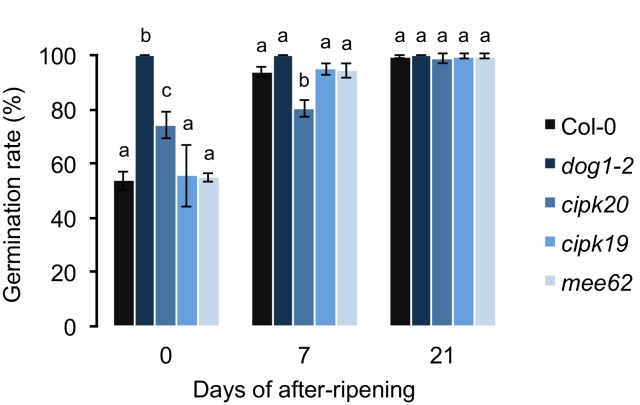
Figure 2—figure supplement 1. The effect of mee62, cipk19 and cipk20 knock-outs on dormancy.
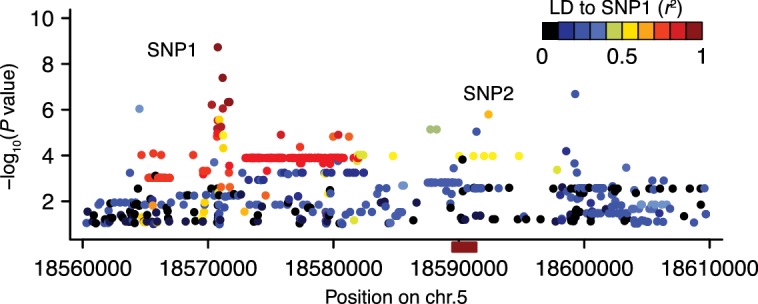
Figure 2—figure supplement 2. The linkage disequilibrium pattern in the region surrounding DOG1.


