. 2016 Dec 14;5:e22502. doi: 10.7554/eLife.22502

Figure 4. Changes in DOG1 haplotype frequency in southern Sweden field experiments.

(A and C) Frequencies in T880 (D2) x Grön 14 (ND), in which SNP2 segregates. (B and D) Frequencies in Bar 1 (ND) x Ull2-5 (D3), in which SNP3 segregates. (AB) Frequency changes across time. Starting frequencies were estimated prior to seed dispersal and adjusted to take into account seed viability (0). Frequencies were then estimated in September (1) and November (2) by genotyping seedlings. Finally, seedlings generated from soil samples were used to estimate frequencies in the seed bank (3). (CD) Difference between starting (0) and ending haplotype frequencies (weighted sum of 1 + 2 + 3).

DOI: http://dx.doi.org/10.7554/eLife.22502.015
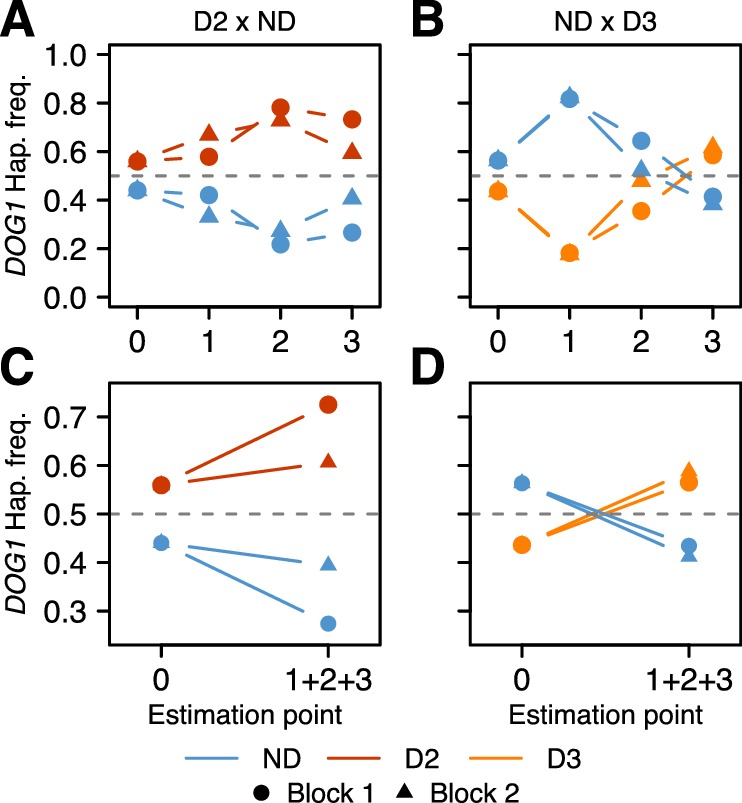
Figure 4—source data 1. Genome-wide genotypes of the field experiments samples.
This file also contains sampling information (block, frame, sampling point etc.) and the NCBI SRA BioProject and BioSamples accession numbers.
elife-22502-fig4-data1.xlsx (963.8KB, xlsx)
DOI: 10.7554/eLife.22502.016

Figure 4.

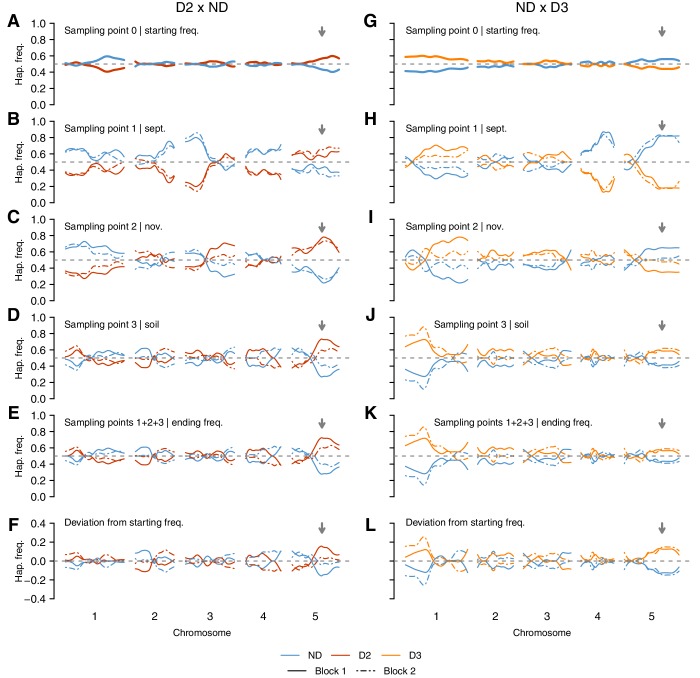
Figure 4—figure supplement 1. Genome-wide changes in DOG1 haplotype frequencies in southern Sweden field experiments.

Figure 4—figure supplement 1.

(AF) Haplotype frequencies in T880 (D2) x Grön 14 (ND), in which SNP2 segregates. (GL) Haplotype frequencies in Bar 1 (ND) x Ull2-5 (D3), in which SNP3 segregates. (A and G) Starting frequencies (sampling point 0) were estimated prior to seed dispersal and adjusted to take into account seed viability. (BD and HJ) Intermediate frequencies estimated in September (sampling point 1) and November (sampling point 2) by genotyping seedlings. Seedlings generated from soil samples were used to estimate frequencies in the seed bank (sampling point 3). (E and K) Ending haplotype frequencies (weighted sum of 1 + 2 + 3). (F and L) Deviation from starting frequencies at the end of the experiment ((1 + 2 + 3) − 0). The vertical grey arrow indicates the position of the DOG1 locus. .