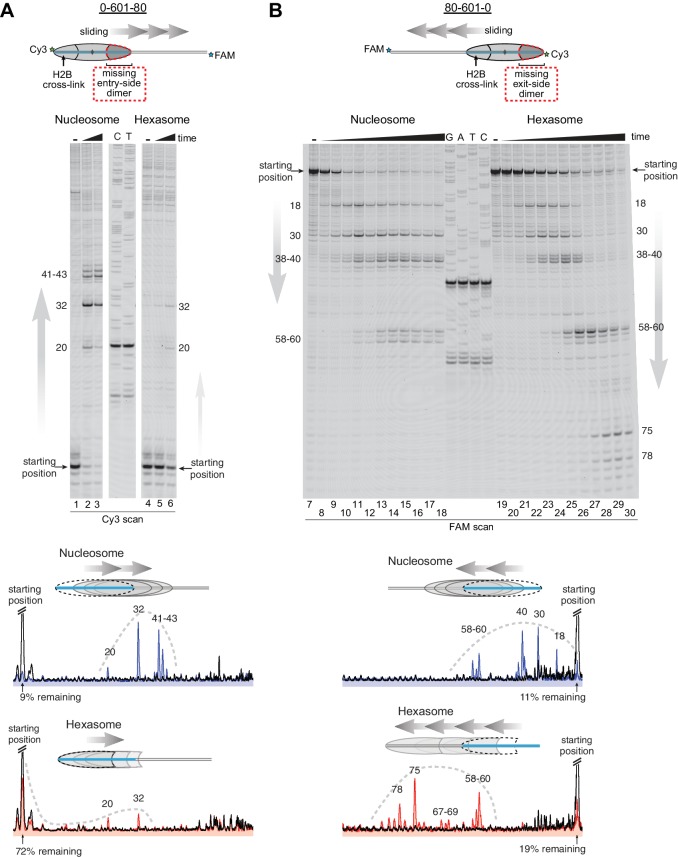
Figure 4. Chd1 requires entry side H2A/H2B for robustly repositioning hexasomes.
(A) Nucleosome and hexasome sliding reactions, visualized through histone mapping. For 150 nM hexasome and nucleosome 0-601-80 constructs, sliding reactions were monitored after incubation with 50 nM Chd1 and 2 mM ATP for 0, 1, and 64 min. Reactions were quenched at time points with the addition of EDTA and competitor DNA. Comparison of intensity profiles for histone mapping reactions are shown below. Samples before ATP addition (0 min) are black, nucleosome sliding reactions after 64 min are blue, and hexasome sliding reactions after 64 min are red. (B) Sliding reactions and intensity profiles carried out with 80-601-0 constructs as described for (A). Time points were 0, 0.25, 0.5, 1, 2, 4, 8, 16, 32, and 64 min. Sliding experiments for 0-601-80 and 80-601-0 were each performed six or more times with similar results. See also Figure 4—figure supplement 1.
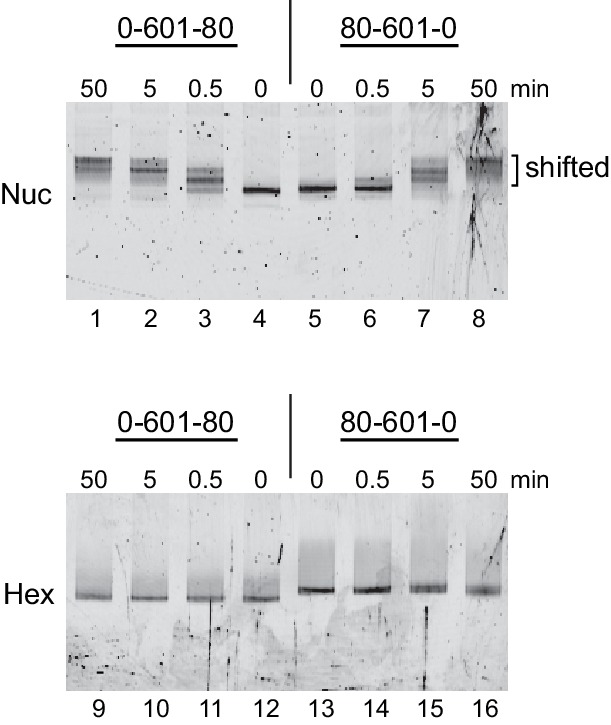
Figure 4—figure supplement 1. Chd1 remodeling dramatically alters nucleosome but not hexasome mobility as assessed by native PAGE.


