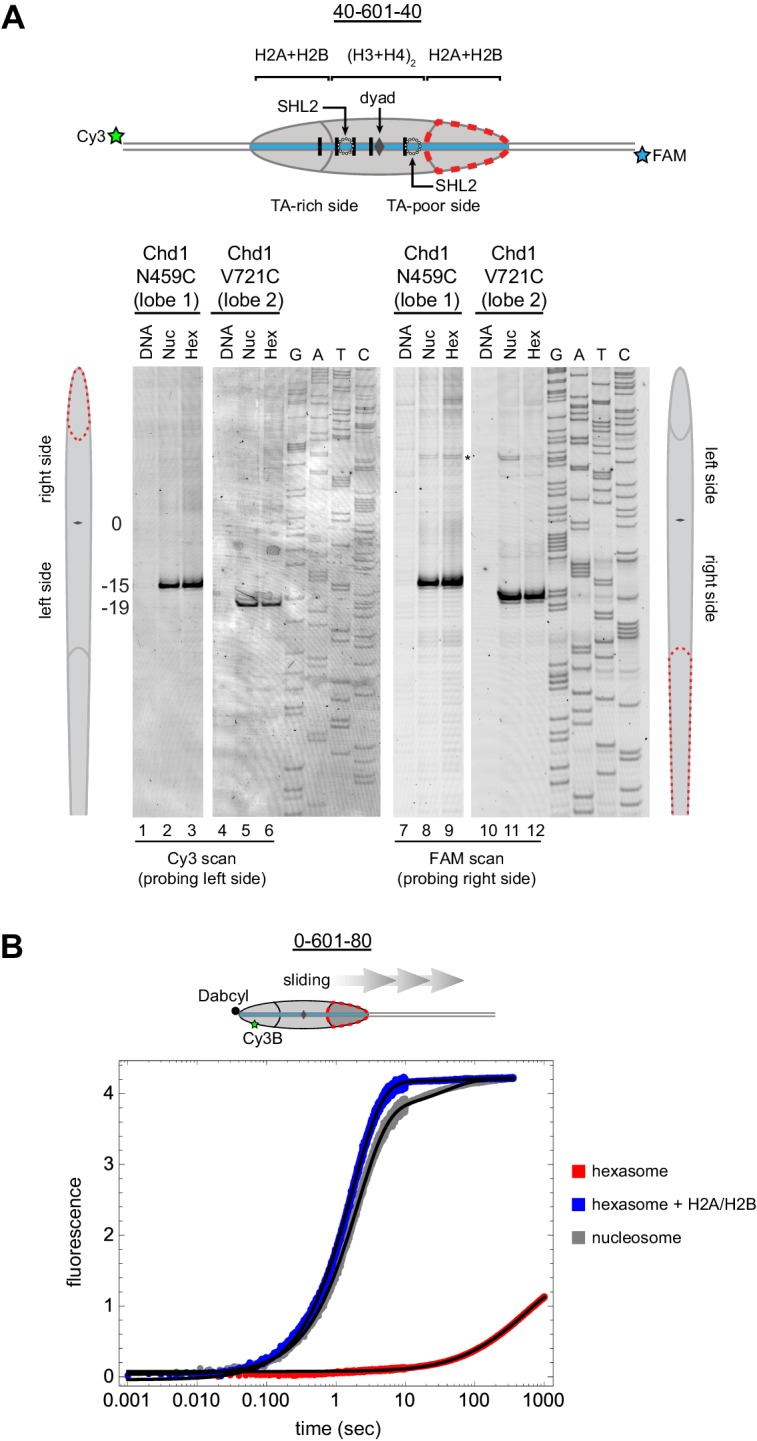
Figure 6. Chd1 requires entry side H2A/H2B for sliding but not binding.
(A) Chd1 cross-linking to 40-601-40 nucleosomes and hexasomes. Single cysteine variants on lobe 1 (N459C) and lobe 2 (V721C) of the Chd1 ATPase cross-linked to DNA 15 and 19 bp from the dyad, respectively, on both sides of nucleosomes and hexasomes. Chd1 was labeled with APB and incubated in a 2:1 ratio with DNA, nucleosomes, or hexasomes in the presence of ADP∙BeF3. After UV irradiation, DNA extraction and cleavage, cross-linking sites were determined by separating DNA fragments on a denaturing gel alongside a sequencing ladder. The gel shown is representative of two independent experiments. Asterisk marks cross-linking from a non-cysteine residue (Nodelman et al., 2017). (B) Stopped flow sliding reactions comparing the activity of Chd1 on 10 nM 0-601-80 nucleosomes, hexasomes, and hexasomes plus 12 nM dimer. Nucleosomes and hexasomes were labeled with Cy3B on H2A-T120C and with Dabcyl quencher on the zero end of the DNA. Reactions were initiated with the addition of saturating (600 nM) Chd1 and 1 mM ATP. Black lines represent double exponential fits of the data. Each progress curve is an average of 3–6 replicate injections, and representative of two independent experiments. See also Figure 6—figure supplement 1.

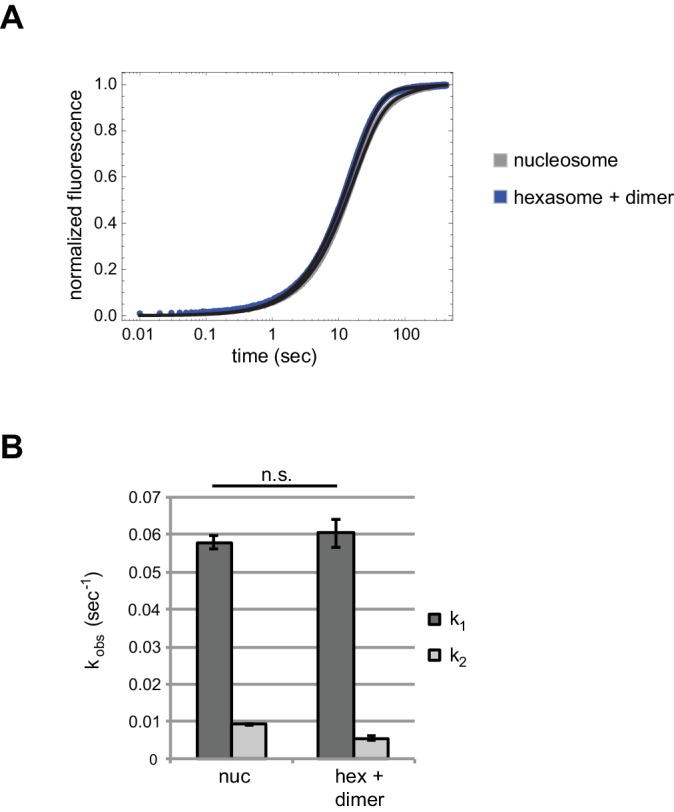
Figure 6—figure supplement 1. Chd1 repositions nucleosome and hexasome plus dimer at similar rates with limiting ATP.

