Figure 7. Disruptions in the nucleosome acid patch only moderately decrease sliding by Chd1.
(A) Overview of disruptions introduced on H2A/H2B. Nucleosome crystal structure shown is PDB code 1KX5 (Davey et al., 2002). (B) Stopped flow sliding reactions using asymmetric nucleosomes containing H2A or H2B disruptions on the entry side H2A or H2B. Asymmetric nucleosomes were generated by incubating 10 nM 0-601-80 hexasomes with 12 nM H2A/H2B containing one of the following sequence variants: Wt (blue); FACT/SWR1 binding surface disruption (H2B-Y39A/M56A) (cyan); H2A C-terminal tail truncation (∆110–129) (green); acid patch single mutant (H2A-E64R) (brown); acid patch double mutant (H2A-D90R/E92A) (orange); acid patch quadruple mutant (H2A-E61A/E64A/D90A/E92A) (magenta). Reactions were performed with 400 nM Chd1 and 25 μM ATP and followed by Cy3B-Dabcyl SQOF. Each progress curve is an average of 3–6 technical replicates. (C) Summary of observed rates (k1, k2) obtained from double exponential fits to stopped flow data as shown in (A). In every case the observed fast rate (k1) contributes >90% of the amplitude of the progress curve. Error bars represent standard deviation from three (six for Wt) independent experiments. Statistics compare k1 rates for indicated constructs: *** p-value <0.00001; **** p-value <0.0000001; n.s., not significant. See also Figure 7—figure supplements 1 and 2.

Figure 7—figure supplement 1. With subsaturating H2A/H2B dimer addition, rates of nucleosome sliding by Chd1 are not sensitive to nucleosome:hexasome ratios.

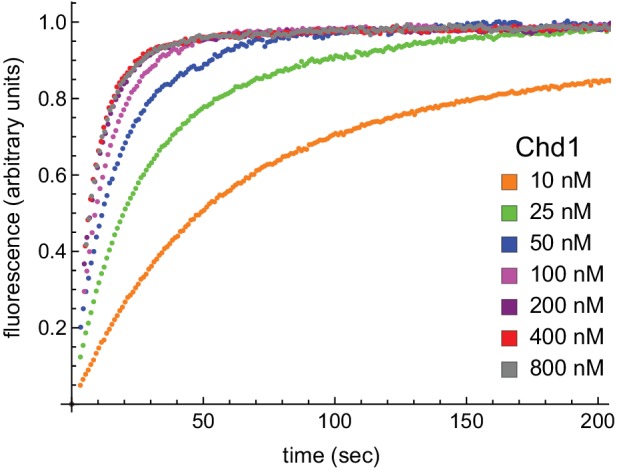
Figure 7—figure supplement 2. With limiting ATP, remodeling saturates at 400 nM Chd1.