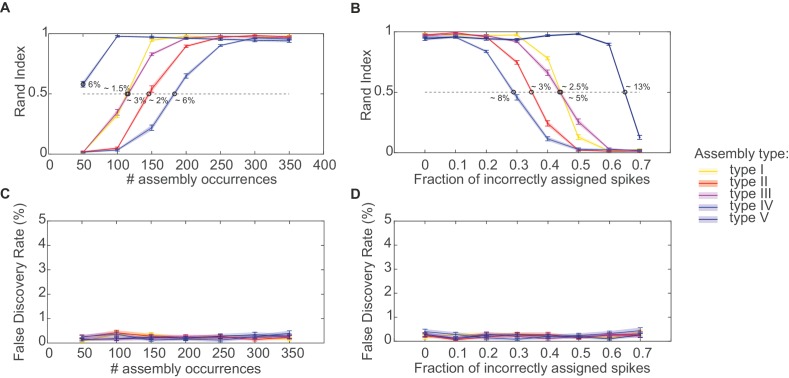
Figure 2. Performance evaluation of assembly detection algorithm.
(A) Rand index , Equation 14, as a function of the total number of occurrences of the assembly pattern in spike time series of length =1400 s, averaged across 50 independent runs, for all five types of assemblies from Figure 1 (as indicated in the inset legend). Percentages at the half-width points of the -curves indicate the proportion of spikes in the time series contributed by the assembly structures at these points. (B) Rand index for all assembly types as a function of the fraction of incorrectly assigned spikes (‘sorting errors’). (C) Fraction of units incorrectly assigned to an assembly across a range of assembly occurrence rates. (D) Fraction of units incorrectly assigned to an assembly as a function of the fraction of misattributed spikes. Error bars = SEM.

