. 2017 Jan 11;6:e19428. doi: 10.7554/eLife.19428

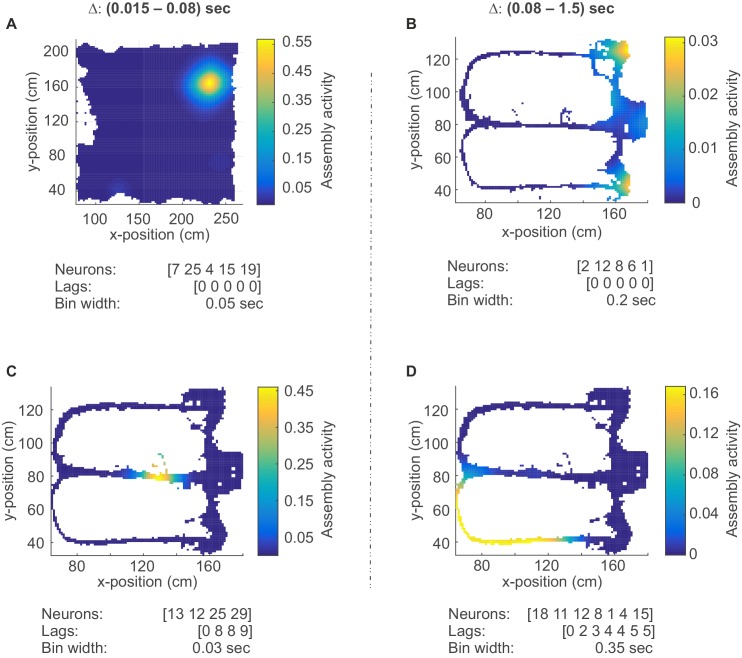
Figure 5. Assembly coding at different time scales in CA1.

Color-coded activity maps for four CA1 assemblies during an environmental exploration task (A) and a delayed alternation task (B, C, D). Below x-axis in each panel: Identities of neurons assigned to the assembly, associated time lags within an assembly, and temporal scale of assembly.

DOI: http://dx.doi.org/10.7554/eLife.19428.009

Figure 5.

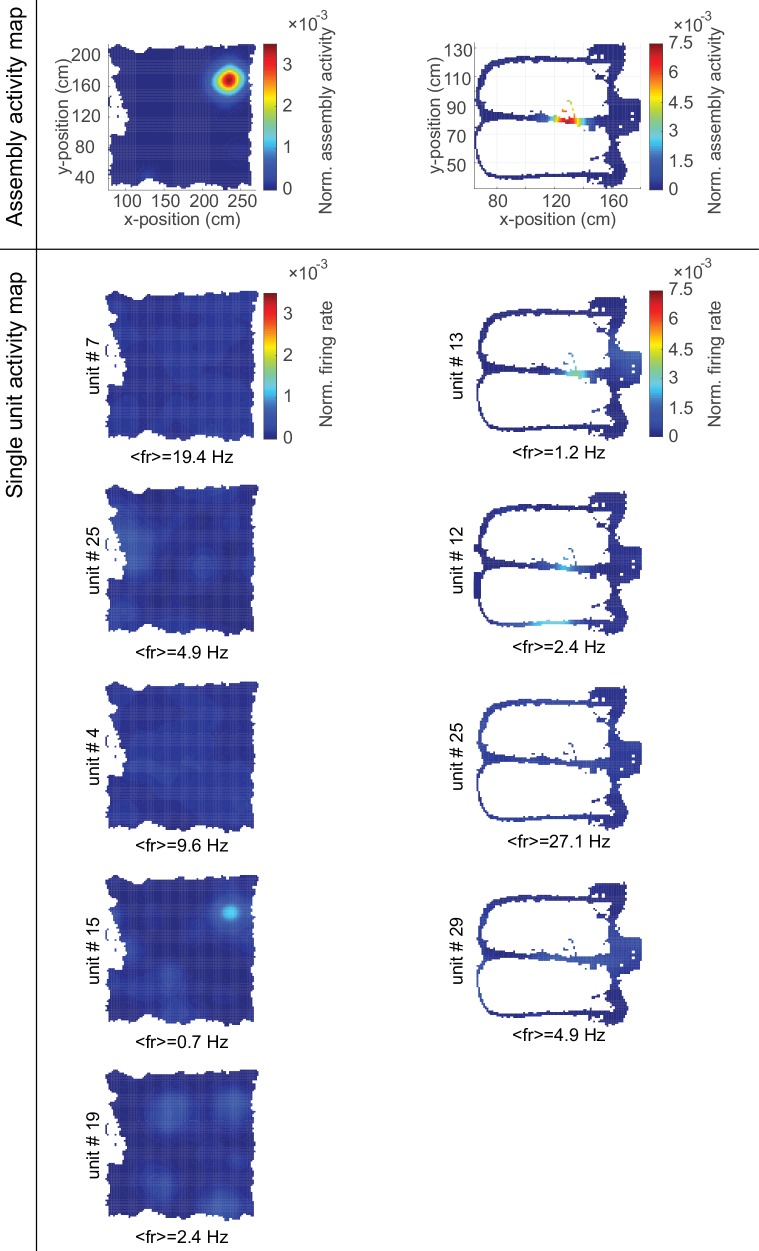
Figure 5—figure supplement 1. Single-unit composition of cell assemblies.

Figure 5—figure supplement 1.

Color-coded normalized (to area under curve) activity maps for two assemblies (top row, Figure 5A and C) and their constituent single neurons (rows below) within an environmental exploration task (left) and a delayed alternation task (right). Average firing rates of the constituent single units indicated below each map.