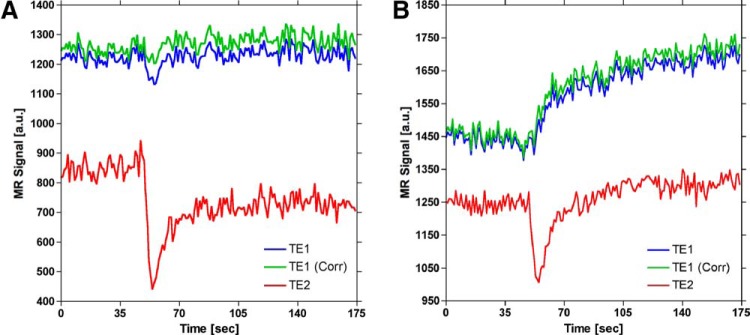
Figure 8.
Demonstration of confounding T2* effects on signals used to generate DCE-MRI concentration–time curves for representative voxels in (A) artery and (B) tumor. The dual-echo signals (blue and red curves) are used to extrapolate the first-echo signal back to TE = 0 (green curve), which eliminates the influence of T2* effects. During the first pass of a bolus injection of a contrast agent, T2* effects can confound T1-weighted signals (blue curve), which can introduce error in DCE-MRI arterial input functions (AIFs). Although the majority of confounding T2* effects are probably masked by T1 shortening, correction for T2* effects in tumor results in an apparent increased rate of signal enhancement, which can influence heuristic DCE-MRI signal analysis (B).

