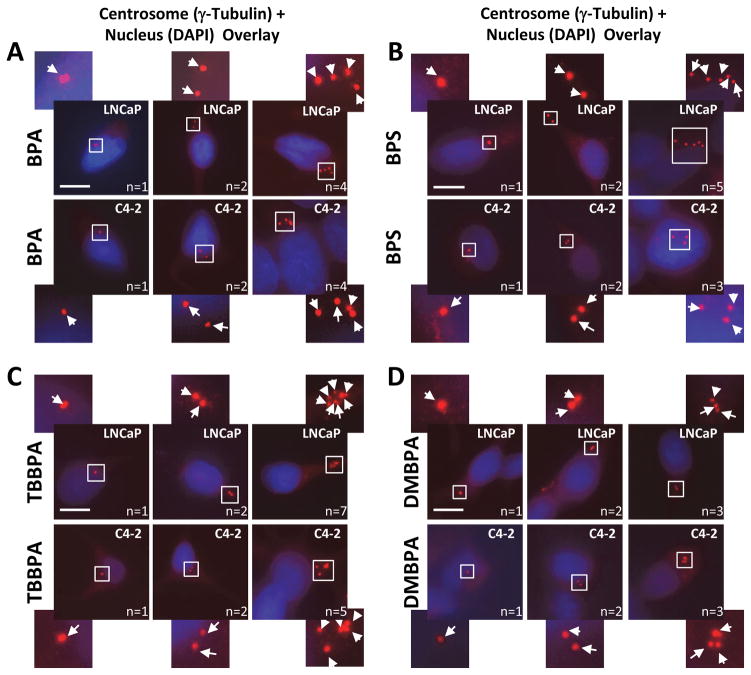
Figure 2. Representative staining showing cells with one, two and >2 centrosomes.
LNCaP and C4-2 PCa cells were treated with BPA, BPS, DMBPA, and TBBPA as indicated. Cells were fixed and immunostained with rabbit anti-γ-tubulin (red). DNA was stained using DAPI (blue). Arrows point to centrosomes (n = number of centrosomes). Pericentrin staining gave similar results. Scale bar, 20 μm. Area in square is magnified and offset to the main panel.

