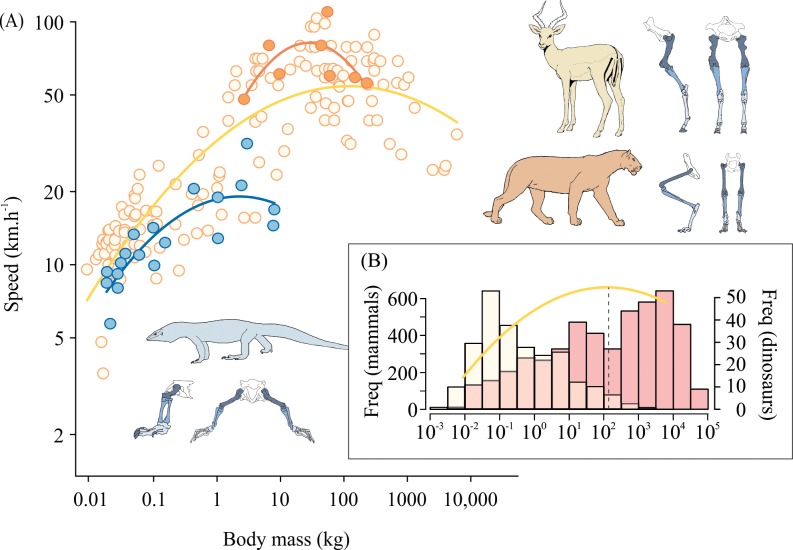
Fig 4.
(A) Top running speeds are reached at different body sizes in (nonfelid) mammals (n = 142), felids (n = 8), and varanids (n = 19). The curvilinear relationship between body mass (kg) and running speed (km h-1) for mammals (yellow), felids (orange), and varanids (blue). Optimum body mass for speed is denoted by the peak of each curvilinear relationship. Original data reported in [40,46–51]. (B) Frequency distribution for the body masses of extant running mammals [52] (n = 2,919; yellow bars) and extinct dinosaur species [1] (n = 406; red bars) shown with the relationship of optimum mass for speed in nonfelid mammals.

