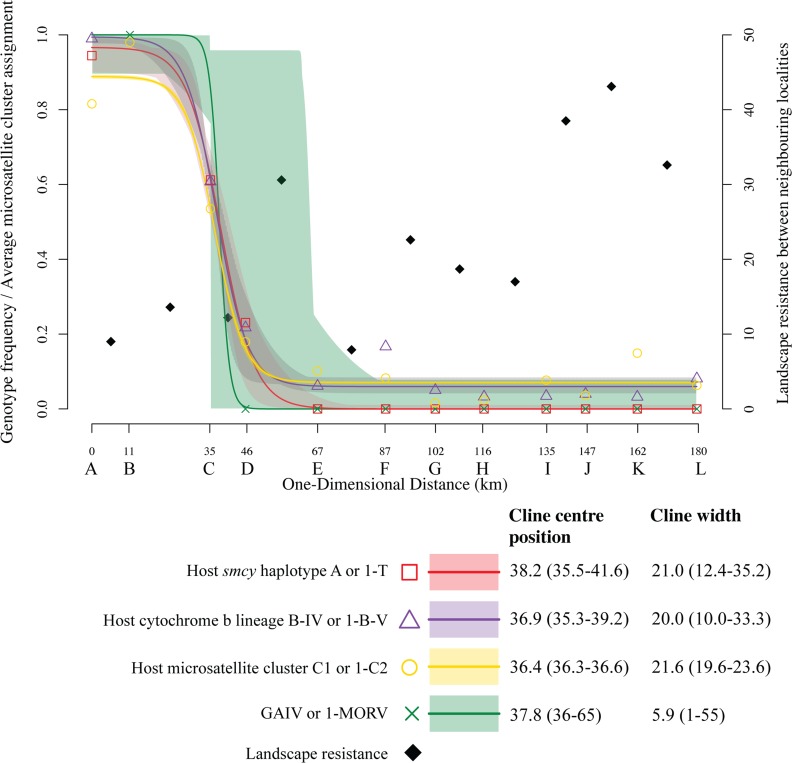
Fig 3. Genotype frequency clines of two M. natalensis cytochrome b and smcy types (binomial error distribution), clines of average assignment to two M. natalensis microsatellite clusters (from STRUCTURE’s K = 2 scenario, Gaussian error distribution) and frequencies of arenavirus species (MORV and GAIV, binomial error distribution).
The one-dimensional positions of the localities (A to L) are their orthogonal projection onto the regression line fit between the centroids of the localities. The support envelopes (polygons) for expected genotype frequencies (lines) under the standard cline model were estimated in Analyse [73]. Squares, triangles, circles and crosses represent the observed proportions/frequencies. Maximum Likelihood estimates and their 2-unit support intervals for cline centres and widths are shown at the bottom right. M. natalensis estimated landscape resistance between neighbouring localities (right y-axis) is depicted with black-filled diamonds at the midpoint between locality pairs (see also S1 Table).

