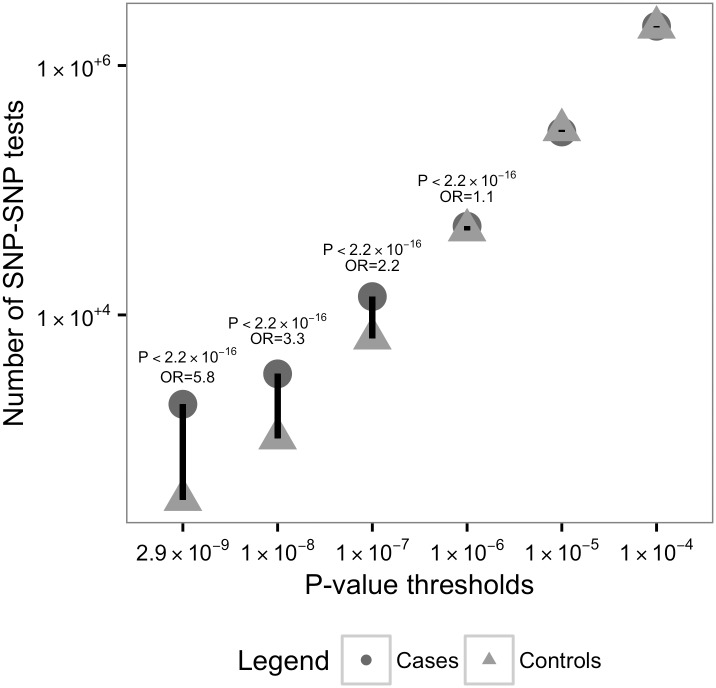
Fig 2. Comparison of number of Ras/MAPK gene epistasis results in ASD cases versus pseudo-controls.
The graph displays number of epistasis tests (y-axis) in the ASD cases (dark gray, circle) and ASD pseudo-controls (light gray, triangle) with P-value thresholds (x-axis, left to right): P < 2.9x10⁻⁹, < 1.0x10⁻⁸, P < 1.0x10⁻⁷, P < 1.0x10⁻⁶, P < 1.0x10⁻⁵, and P < 1.0x10⁻⁴. The 2x2 chi-square test P-value and odds ratio (OR) are included for the epistasis results meeting nominal significance (P < 10−6).

