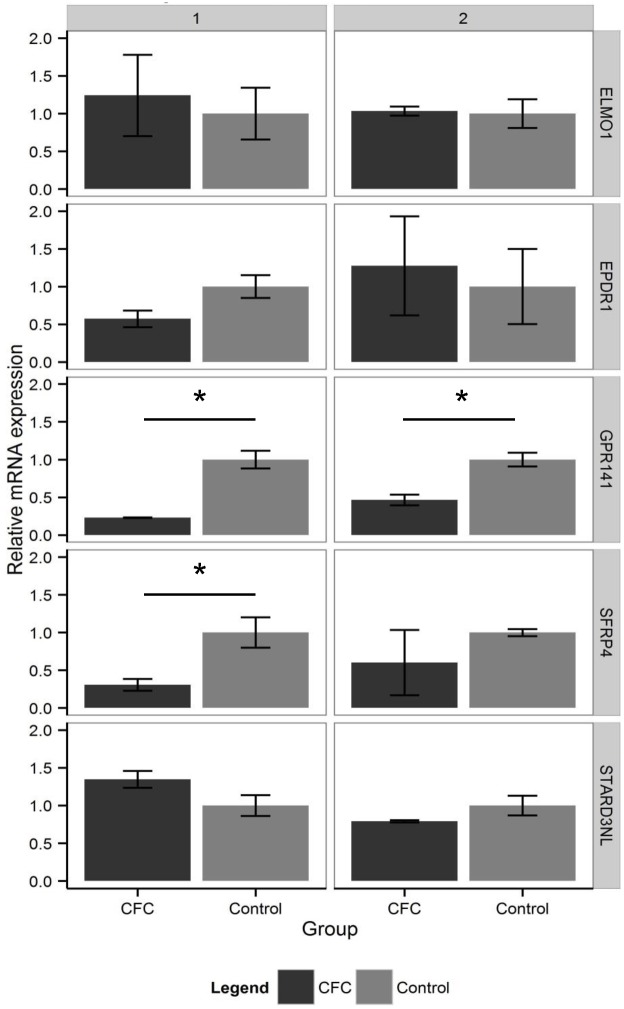
Fig 4. Gene expression in neural cell lines.
For the genes ELMO1, GPR141, SFRP4, EPDR1, and STARD3NL, the graph displays the normalized mRNA expression relative to controls measured by qPCR for two independent experiments. NME8 had undetermined quantities in the first experiment (1) and extreme variance in the second experiment (2) due to low expression level, and therefore was excluded from the graph (S3 Table). The error bars denote the standard error of the sample measurements, and the asterisk denotes a t-test P-value < 0.05 between CFC (dark gray) and control (light gray).

