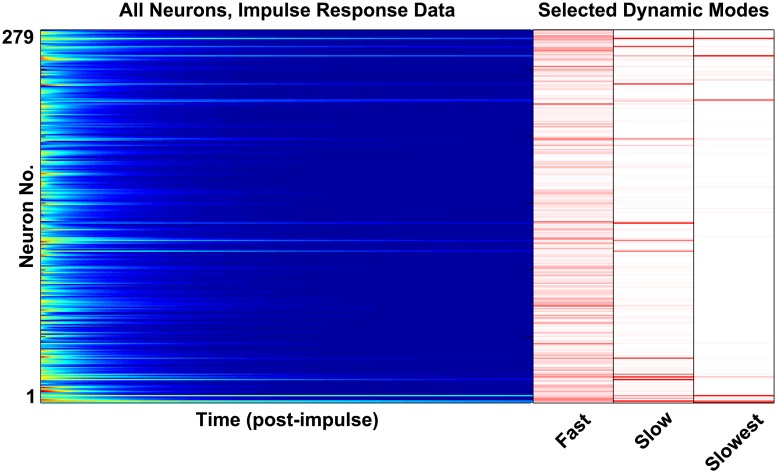
Fig 2. The raster plot at left plots shows a single trial of neuron voltage responses to a random impulse.
The nonlinear network dynamics encode six clusters of dynamic modes with timescales spanning three orders of magnitude. In the right panel we plot a subset of the dynamic modes which we extract from these dynamics (the ϕ vectors calculated from Eq 14). The modes shown are those with the slowest timescales, later referred to as Modes 4, 5 and 6. One can see the modal dynamics within the raster plot (e.g. one can see traces of the “slow” and “slower” modes, each decaying at a different rate).

