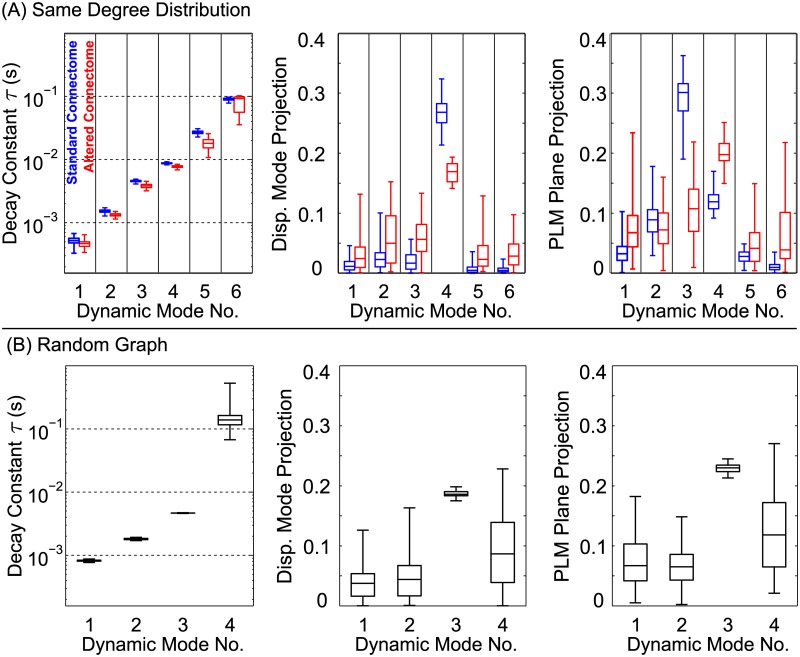
Fig 5. Analysis was repeated for different network connectivities.
Each new boxplot takes data from 10 trials of 5 different randomly-generated networks: (A) Results from networks generated to have an identical degree distribution. The τ distributions for modes 2–6 are statistically different for the altered networks, but still mostly overlap. Projection values (B), however, are both statistically distinct and have very little overlap in some cases (particularly, the Displacement Mode projection of Mode 4, and the PLM Plane Projection of Mode 3). Results from fully random networks. Changing the degree distribution changes the number of modes and their timescales. This shows that the dynamic modes and timescales are encoded by the network’s degree distribution and specific connectivity. This suggests that behavioral dynamics are partially encoded within the connectome itself, the connectivity of which facilitates proprioceptive control.

