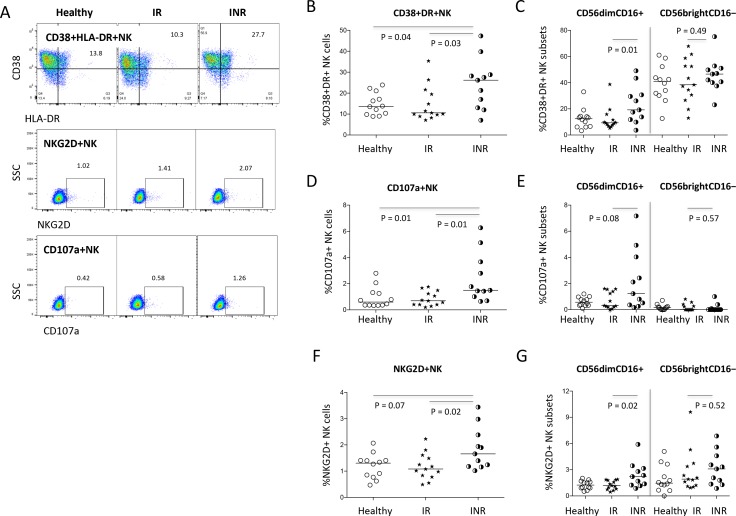
Fig 2. NK cell activation in treated HIV disease.
(A) Dot plots represent the gating strategies from one representative donor of each study group. The median frequencies of CD38+HLA-DR+ NK cells (B) and NK cell subsets (C) among healthy controls, immunologic responders, and immunologic non-responders. The median frequencies of CD107a+ on NK cells (D) and NK cell subsets (E) in healthy controls, immunologic responders, and immunologic non-responders. The median frequencies of NKG2D+ on NK cells (F) and NK cell subsets (G) in healthy controls, immunologic responders, and immunologic non-responders.

