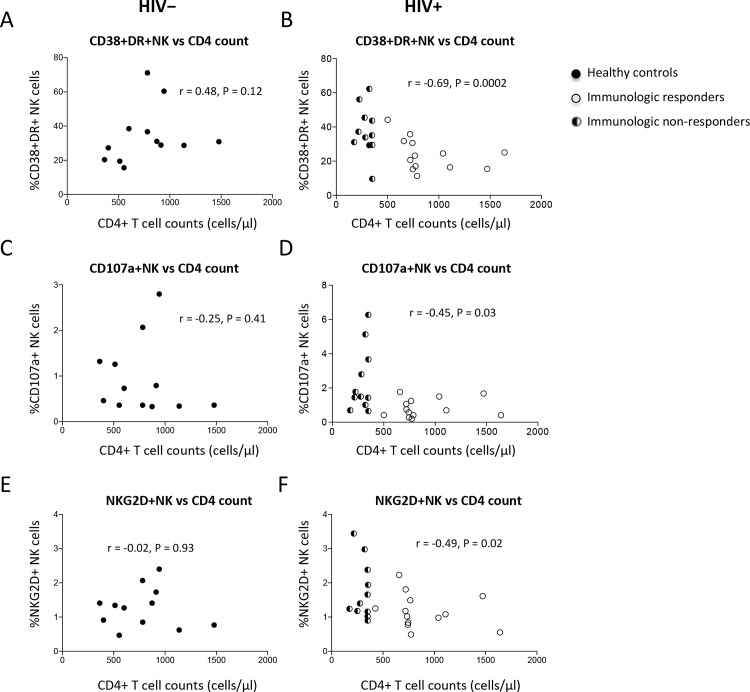
Fig 4. NK cell activation and peripheral CD4+ T cell counts.
Correlations between the percentages of co-expression of CD38 and HLA-DR on NK cells and CD4+ T cell counts in healthy controls (A) and HIV+ subjects (B), between the percentages of CD107a-expressing NK cells and CD4+ T cell counts in healthy controls (C) and HIV+ subjects (D), and between the percentages of NKG2D-expressing NK cells and CD4+ T cell counts in healthy controls (E) and HIV+ subjects (F).

