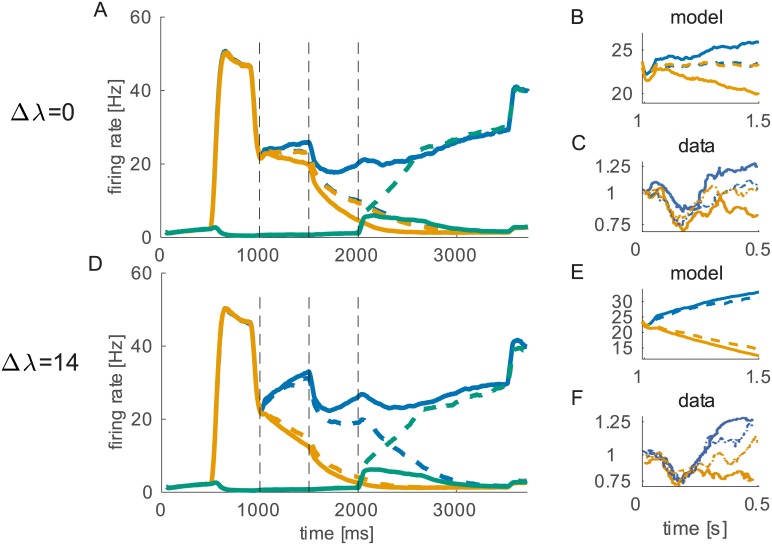
Fig 2. Neurophysiological activity of the model.
Orange/blue/green lines represent R/L/S pool firing rates. Continuous lines show average firing rates of trials when either L or R was chosen. Dashed lines are average rates of trials when the sure option was chosen (i.e. pool S won). The network shows different dynamics depending on the winning pool. When the sure target was chosen, the firing rates of the L and R pools remain similar during input presentation. This behavior closely resembles the one observed in LIP by [3]. A: Average firing rates for Δλ = 0. B,E: magnification during stimulus period. C,F: experimental data (showing normalized firing rate), time is relative to motion input onset. D: Average firing-rates for Δλ = 14 Hz (correct trials).

