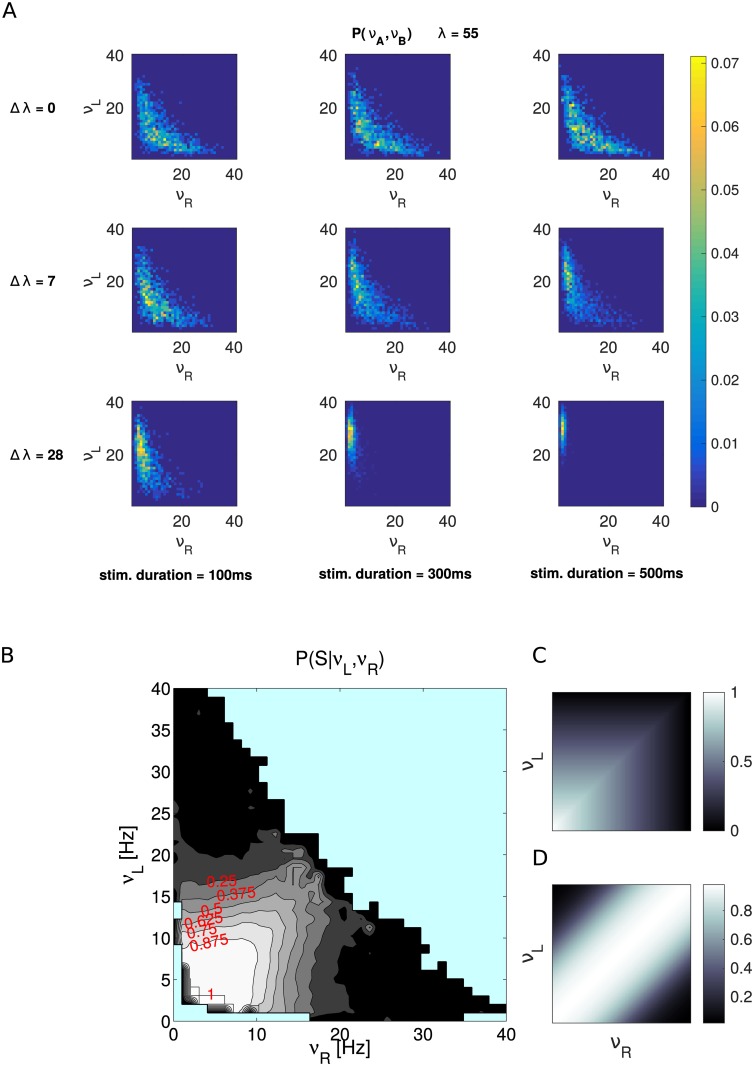
Fig 4. Probability distributions of firing rates and conditional probability of sure choices.
We represent the state of the spiking network using the mean firing rate of pools L and R in the 50 ms before the “sure” target onset, νL and νR respectively. A: Each panel shows the probability distribution of νL and νR for a given combination of stimulus evidence (Δλ) and stimulus duration (calculated using 1000 trials). B: Conditional probability of choosing the sure target given the state of the system in the νL,νR plane. Light blue indicates points with less than 30 trials. C: Cartoon showing the idealized P(S|νL, νR) ≈ max{νL, νR} predicted by the model. D: Cartoon showing the corresponding prediction of the model proposed in [9]: P(S|νL, νR) ≈ σ(|νL − νR|).

