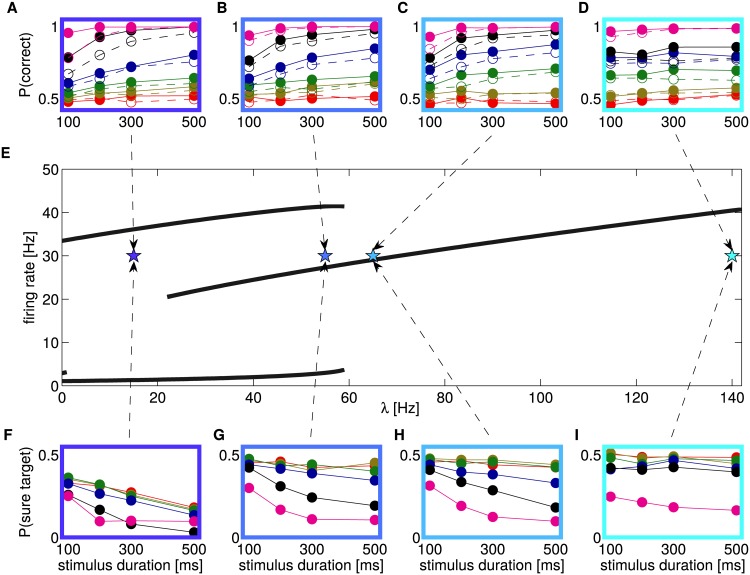
Fig 6. Bifurcation diagram and psychophysics measures in different regions.
A-D: P(C) for trials when the sure target was (not) shown are represented with filled (open) circles. The color of the box and the arrows indicate the value of λ used. E: Bifurcation diagram over parameter λ. The curves represent the firing rates of pools L and R in the attractor (according to the mean-field reduction of the spiking network). Four regions appear (in order of increasing λ): A first tiny multistable region when both decision and spontaneous attractors appear; a bistable region where only the two decision attractor are present; a multistable region, where decision attractors coexist with a “mixed” attractor (both pool have intermediate firing rate); a monostable region, where only the “mixed” attractor exists. F-I: P(S) for different values of λ (color convention as in A-D). Error bars indicating the standard deviation have been omitted since they are always smaller than symbols.

