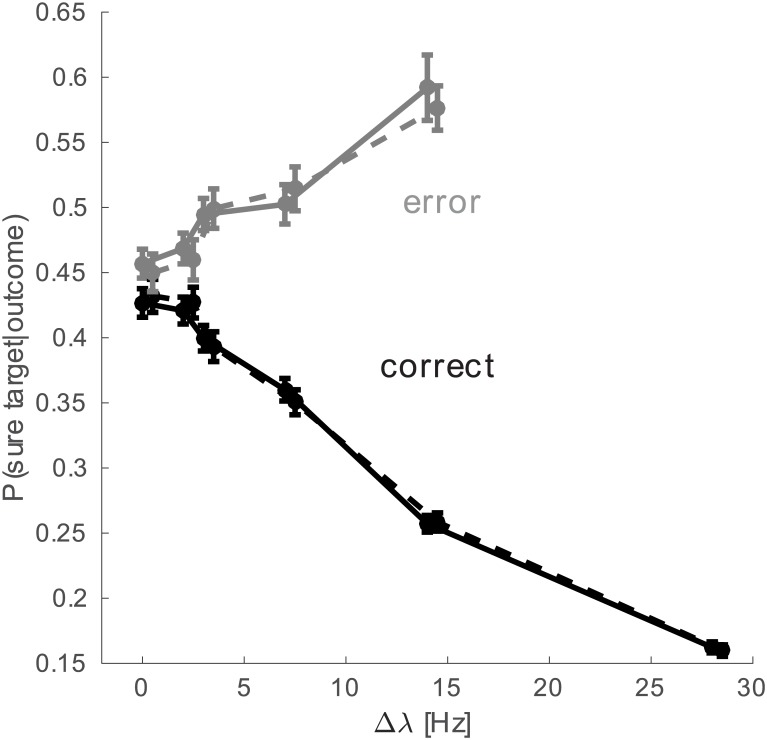
Fig 7. Probability of choosing the “sure target” as a function of Δλ for early correct and error trials.
Continuous line is the prediction from the spiking network. Dashed lines are predictions of the reduced probabilistic model (points are slightly shifted on the horizontal axis for better visibility).

