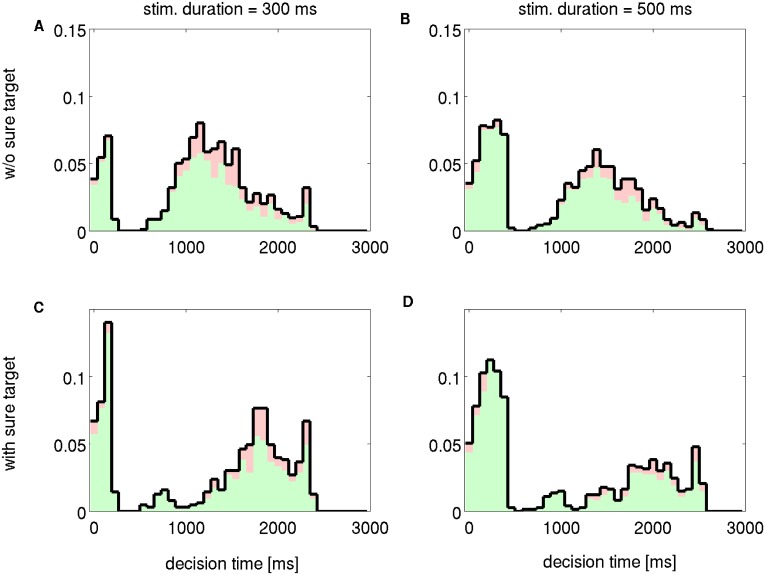
Fig 8. Decision times distributions for two different durations and in forced choice trials (upper row) and free choice trials (bottom row); Δλ = 7 Hz for all panels.
The color of the histogram represents the relative contribution of correct (green) and error (red) trials to the global distribution.

