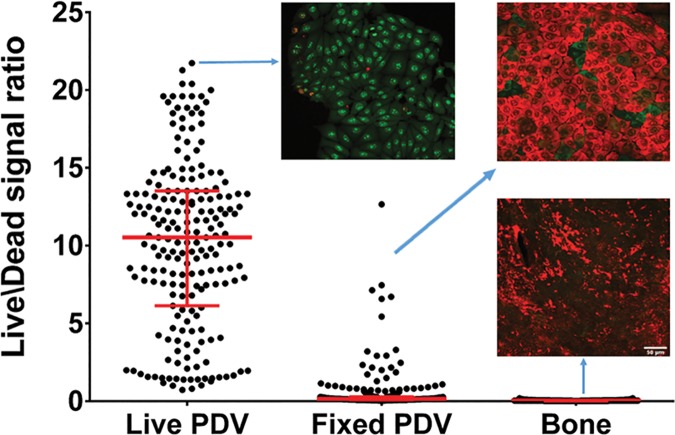
Fig 1. Confirmation of absence of eukaryotic live cells in analyzed bone material.
Graph shows live/dead ratio values determined for cells and bones, horizontal bar is median and whiskers represent interquartile range. Differences in live/dead ratio are statistically significant, all medians vary between themselves significantly (Kruskal-Wallis test, p<0.05). Live PDV–positive control sample; green color confirms activity of live eukaryotic cells; Fixed PDV–negative control sample; red color confirms lack of live eukaryotic cells. Bone–analyzed material; red color confirms lack of live eukaryotic cells in analyzed rat jaws.

