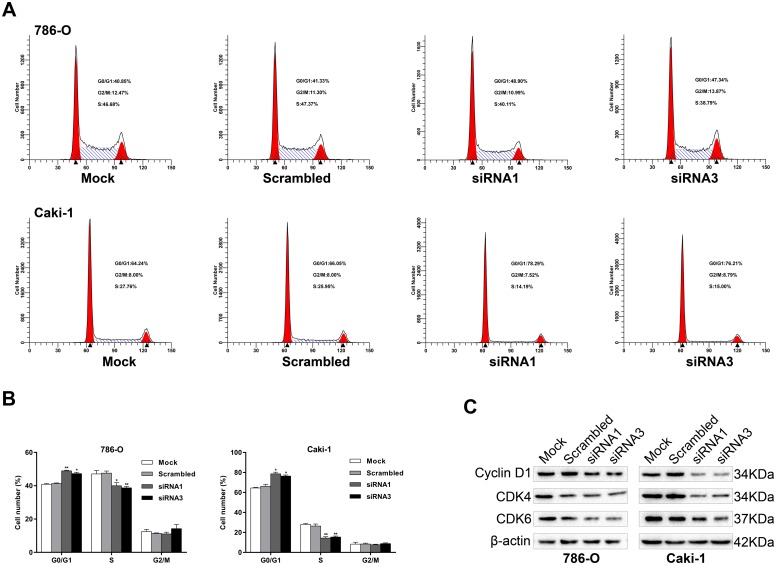
Fig 3. Effects of FUBP1 on cell cycle arrest and levels of cell cycle regulator expression in 786-O and caki-1 cells.
(A and B) Representative data from flow cytometry analysis of the cell cycle distribution in 786-O-siRNA1/3, caki-1-siRNA1/3, and the corresponding control cells (786-O-Mock/Scrambled and caki-1-Mock/Scrambled). The percentage of cells in the G0/G1, S, and G2/M phases was quantified and plotted. (C) Western blot analysis of cyclin D1, CDK4, and CDK6. β-actin was used as the loading control. Values are expressed as the mean ± SD of at least three independent experiments. *P < 0.05, **P < 0.01.

