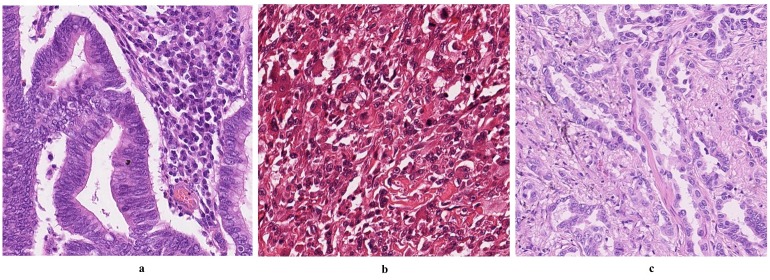
Fig 3. Sample images from the datasets used in our experiments.
Images a, b, and c are samples from colon, breast, and lung cancer images, respectively. All of the datasets are H&E stain images. One can notice the huge variation in the colour appearance as they are applied to different tissue types and processed in different labs using two different scanners. These variations in colour appearance are really challenging for most of the stain deconvolution algorithms.

