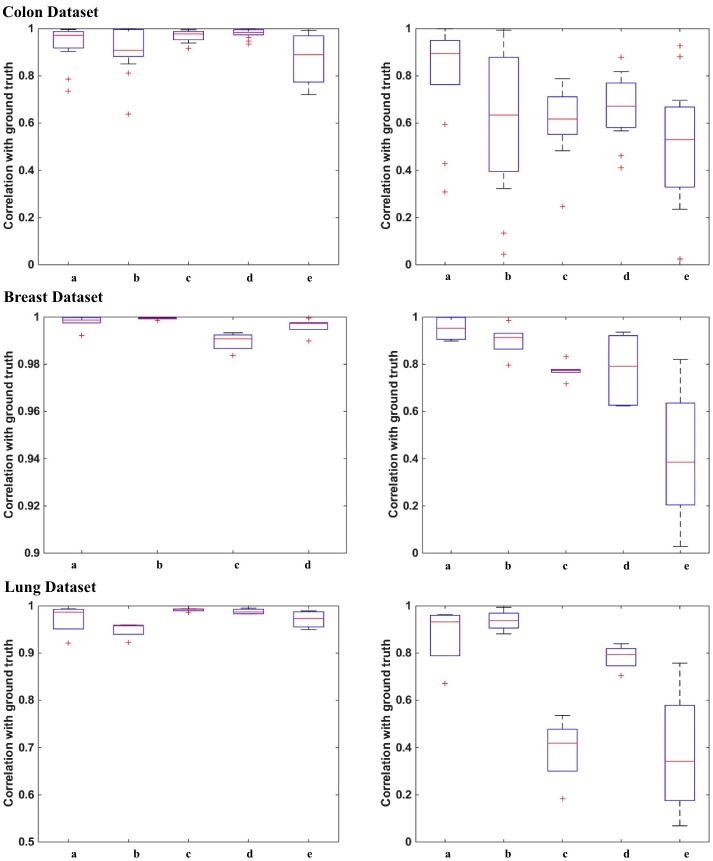
Fig 5. Correlation between the density maps and the ground truth.
Indices a, b, c, d, and e of the x-axis show the correlation results for the Proposed method, Macenko et al. [11], Ruifrok and Johnston [10], BCD [13],and ICA [12], respectively. Due to the high difference in the correlation margin between ICA and the other algorithms in the H density estimation for the second dataset, ICA has been removed in order to make the correlations of the other algorithms noticeable.

