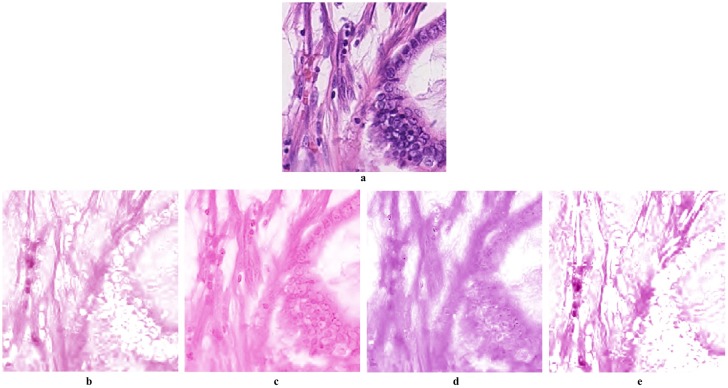
Fig 8. Estimation of Eosin channel for a sample image.
Images a,b,c,d and e corresponds to the original image, Ruifrok and Johnston [10], Macenko et al. [11], BCD [13], respectively. We can notice in Ruifrok and Johnston method [10] that the pre-estimated mixing parameters is actually not reflecting the Eosin stain colour distribution in the original image. In Macenko et al. [11] method, the colour estimation is affected by the correlation between the two stain colours. In BCD method [13], the fine variation within the H stain is merged with the E due to the projection on the chromaticity plane. In the proposed method however, the variation of the stain colour distribution in the original image is perfectly reflected and H channel is smoothly separated.

