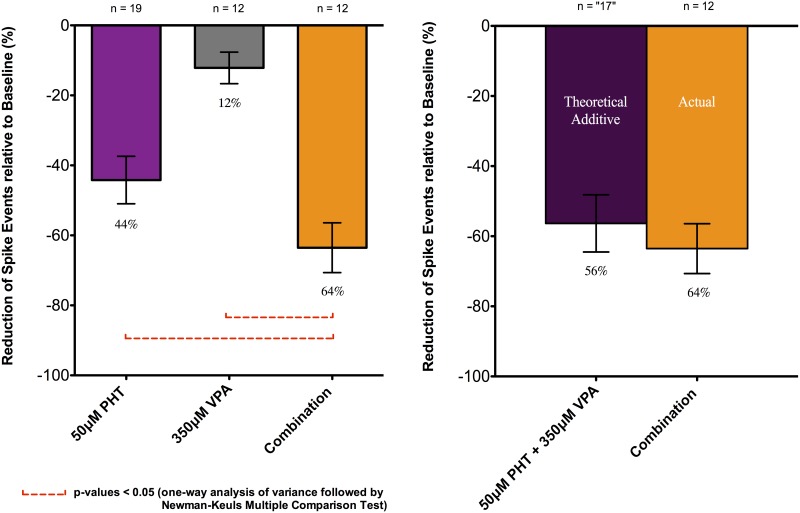
Fig 5. Effects of PHT, VPA applied in isolation and in combination upon frequency of spike events.
Data were expressed as relative percentage (%) reduction compared to the baseline. All data were shown as mean ± SEM; “n” indicates the number of recordings from different slices. See text for details.

