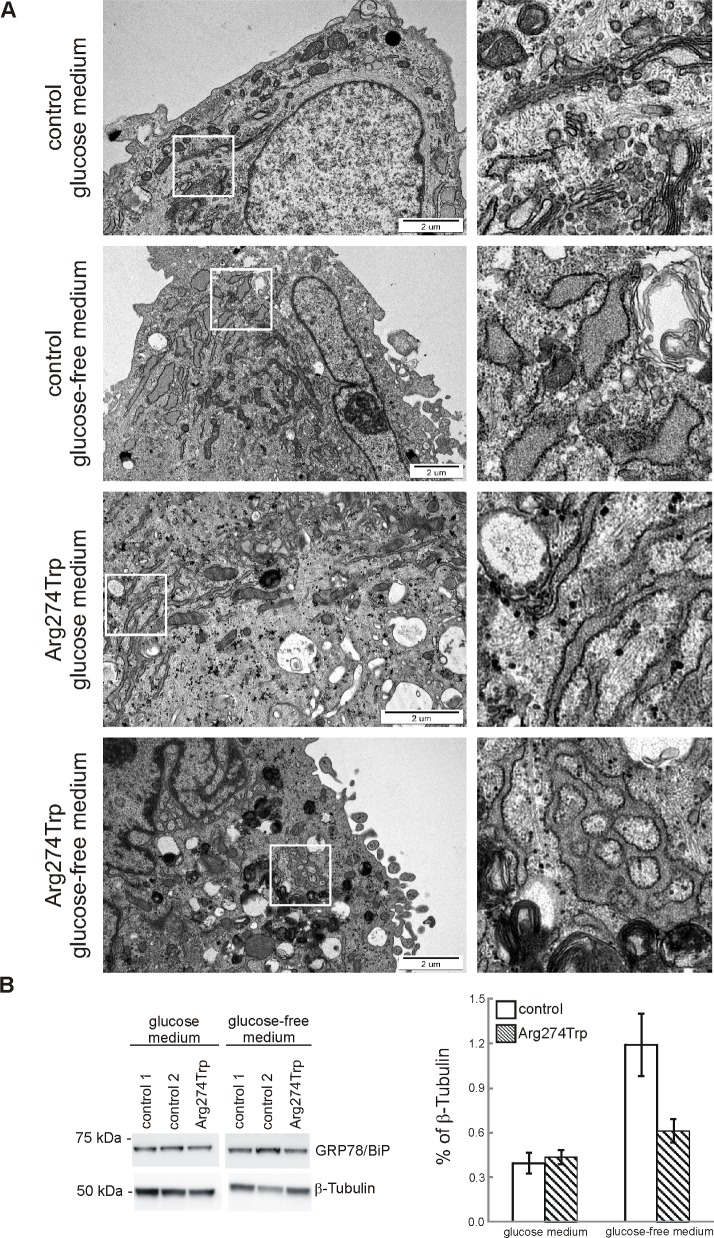
Fig 4. Endoplasmic reticulum morphology and reticulum stress in control and proband-derived fibroblasts cultured for 72 hours in glucose and glucose-free medium.
A. Representative transmission electron microscopy images of ultrastructure of endoplasmic reticulum (ER) are shown. On right, zoomed pictures to highlight distinct ER structures. Bar = 2 μm. B. Immunoreactivity of reticulum stress marker, GRP78/BiP, was analysed by western blot. Densities of GRP78/BiP bands were evaluated and data are expressed as a percentage of β-Tubulin. (mean ± SD, n = 2–3).

