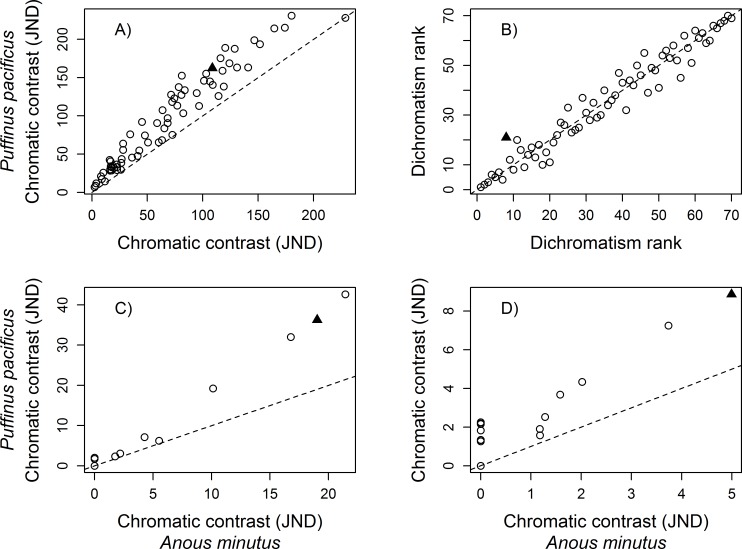
Fig 3. Effect of the photoreceptor density parameter on calculated sexual dichromatism scores.
Comparison of A) the mean sexual dichromatism scores (in JNDs), and B) ranks of 70 galliform species for a UVS eye type with different photoreceptor densities. Values on the x-axis were generated using the parameters associated with the ‘average UVS eye-type’ visual system but with the photoreceptor densities found in Anous minutus (SWS1–1.00, SWS2–9.59, MWS– 16.82, LWS– 14.29); values on the y-axis were generated with the ‘average UVS eye-type’ visual system but with the photoreceptor densities found in Puffinus pacificus (SWS1–1.00, SWS2–0.68, MWS– 1.04, LWS– 1.44; see Methods). The solid triangle symbol in A) identifies the species that experienced the greatest change in mean dichromatism score, and the greatest change in rank in B). The sexual dichromatism score of each patch of the species highlighted in A), under the two sets of parameters, are presented in C). The sexual dichromatism score of each patch of the species highlighted in B), under the two sets of parameters, are presented in D). In C) and D), the solid triangle symbol identifies the patch that experienced the greatest change in dichromatism score. Dashed lines represent 1:1 reference line.

