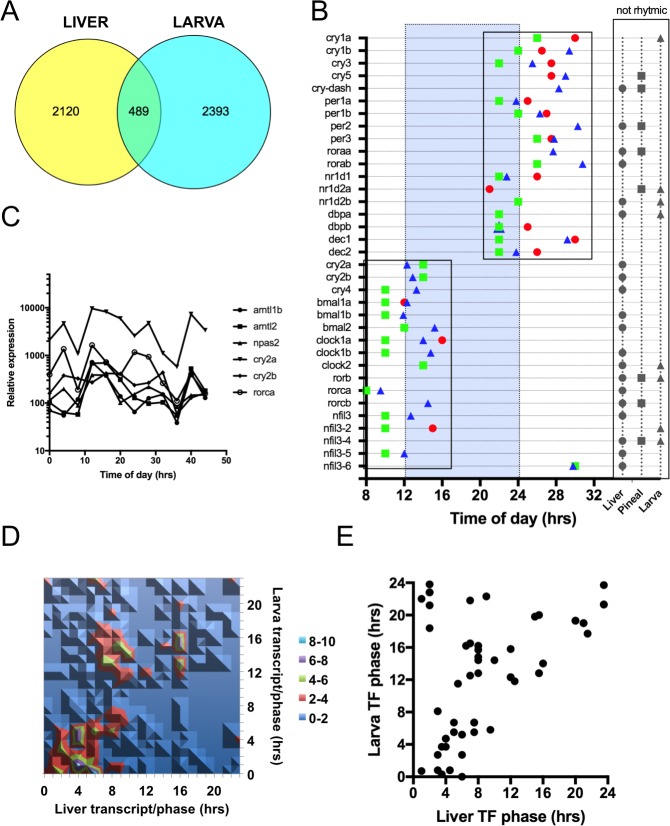
Fig 2. Comparison between Zebrafish larval and liver time courses.
(A) Venn diagram of the rhythmic transcripts identified in Zebrafish larva and liver. The larval genes are the common rhythmic genes from 5d old larva collected every 4hrs under LD (14:10) and DD (2882 ENSEMBL genes)[43]. (B) Expression phases of clock genes in zebrafish pineal gland, larva and liver. Red circle: liver; Green square: pineal gland (from [44]; Blue triangle: larva. Grey symbols correspond to arrhythmic genes. (C) Diurnal profiles of selected arrhythmic liver clock genes from panel B. (D) Contour plot of the 489 common cycling genes between the liver and larval time courses. Color code in legend represents the number of genes at each phase intersection. (E) Scatter plot of the phases of all cycling TF genes between the liver and larval time courses.

