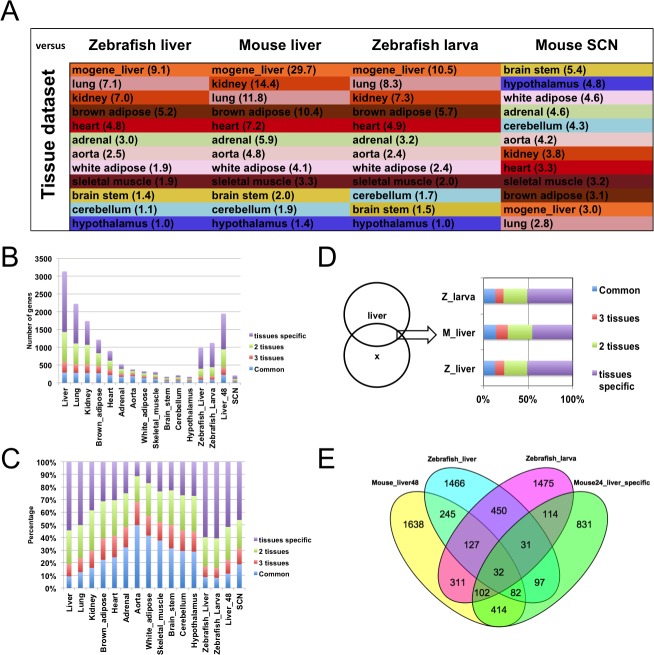
Fig 4. Zebrafish and mouse liver rhythmic genes compared to 12 mouse tissue time courses.
(A) Color-coded table displaying the ranking from highest to lowest of the Tanimoto-Jaccard index from the comparison of the Zebrafish or Mouse liver time courses against 12 different tissues time courses from Zhang et al. [12]. As controls, Zebrafish larval and Mouse SCN datasets were also compared with the 12 tissues ensemble. (B) Number of common (present in 4 to 12 tissues) or tissue specific genes (present in 1 to 3 tissues) in the 12 tissues and surveyed datasets. (C) Proportion of common (present in 4 to 12 tissues) or tissue specific genes (present in 1 to 3 tissues) in the 12 tissues and surveyed datasets. (D) Proportion of common (present in 4 to 12 tissues) or tissue specific genes (present in 1 to 3 tissues) in the intersection of the Venn diagram between the mouse liver and the Zebrafish larval, liver or Mouse liver (Liver_48) time courses. (E) Venn diagram between the complete mouse liver (Liver_48), Zebrafish liver and larval datasets and the liver specific subset from the mouse liver in [12].

