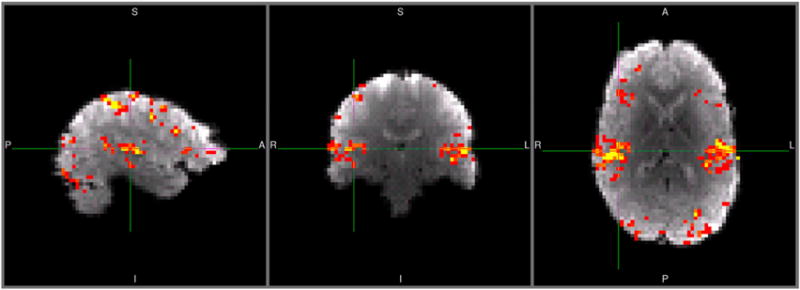
Figure 2.

Mean difference between dynamic and static model F-values for a representative subject at 3T. Colour range from red to yellow represents F-value differences from 0.25 to 2, respectively. [To view this figure in colour, please see the online version of this Journal.]
